Freelance Tracker
Weekly Job Postings Summary
Every week, we deliver a comprehensive analysis of the French IT freelance landscape.
This report includes insights on job postings, remote work trends, salary analysis, and more.
- We maintain a backlog of analysis ideas. Send yours to tracker-it@rekolt.co.
- Join our telegram channel for weekly updates and for occasional REKOLT project briefs and mission descriptions.
report for week starting May 25, 2026
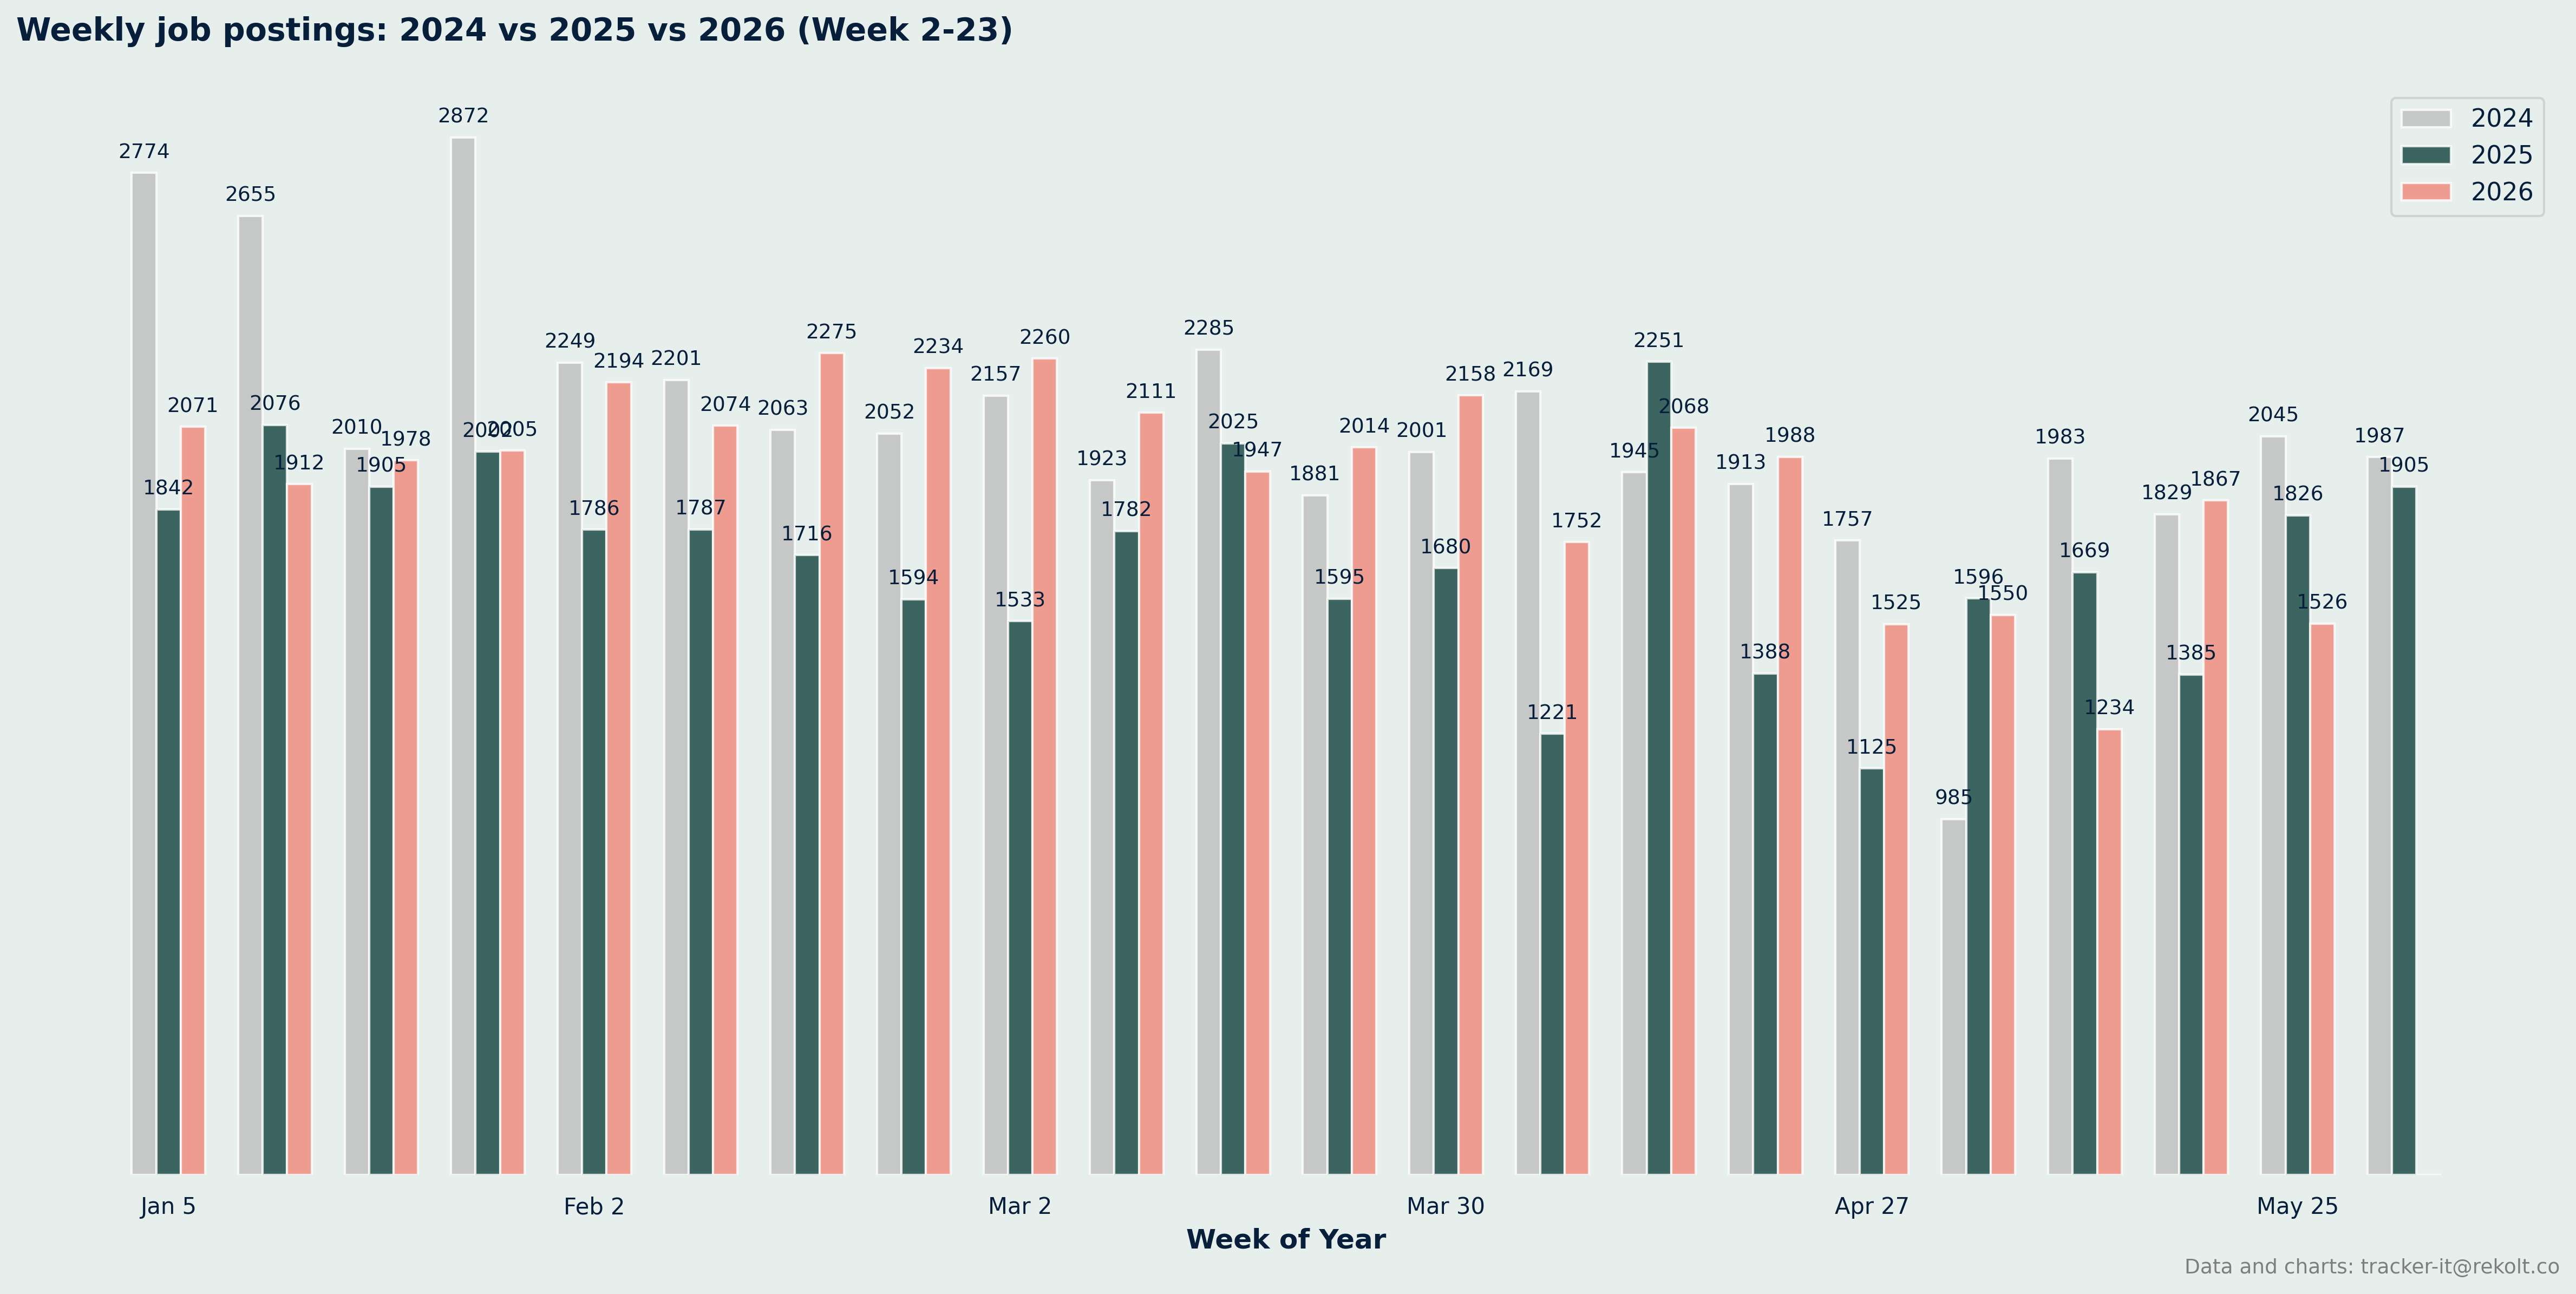
Weekly Vs Last Year Summary
📈 Comparison Summary
2024: 21 weeks, 43749 total jobs, avg 2083 jobs/week
2025: 21 weeks, 35784 total jobs, avg 1704 jobs/week
2026: 21 weeks, 40743 total jobs, avg 1940 jobs/week
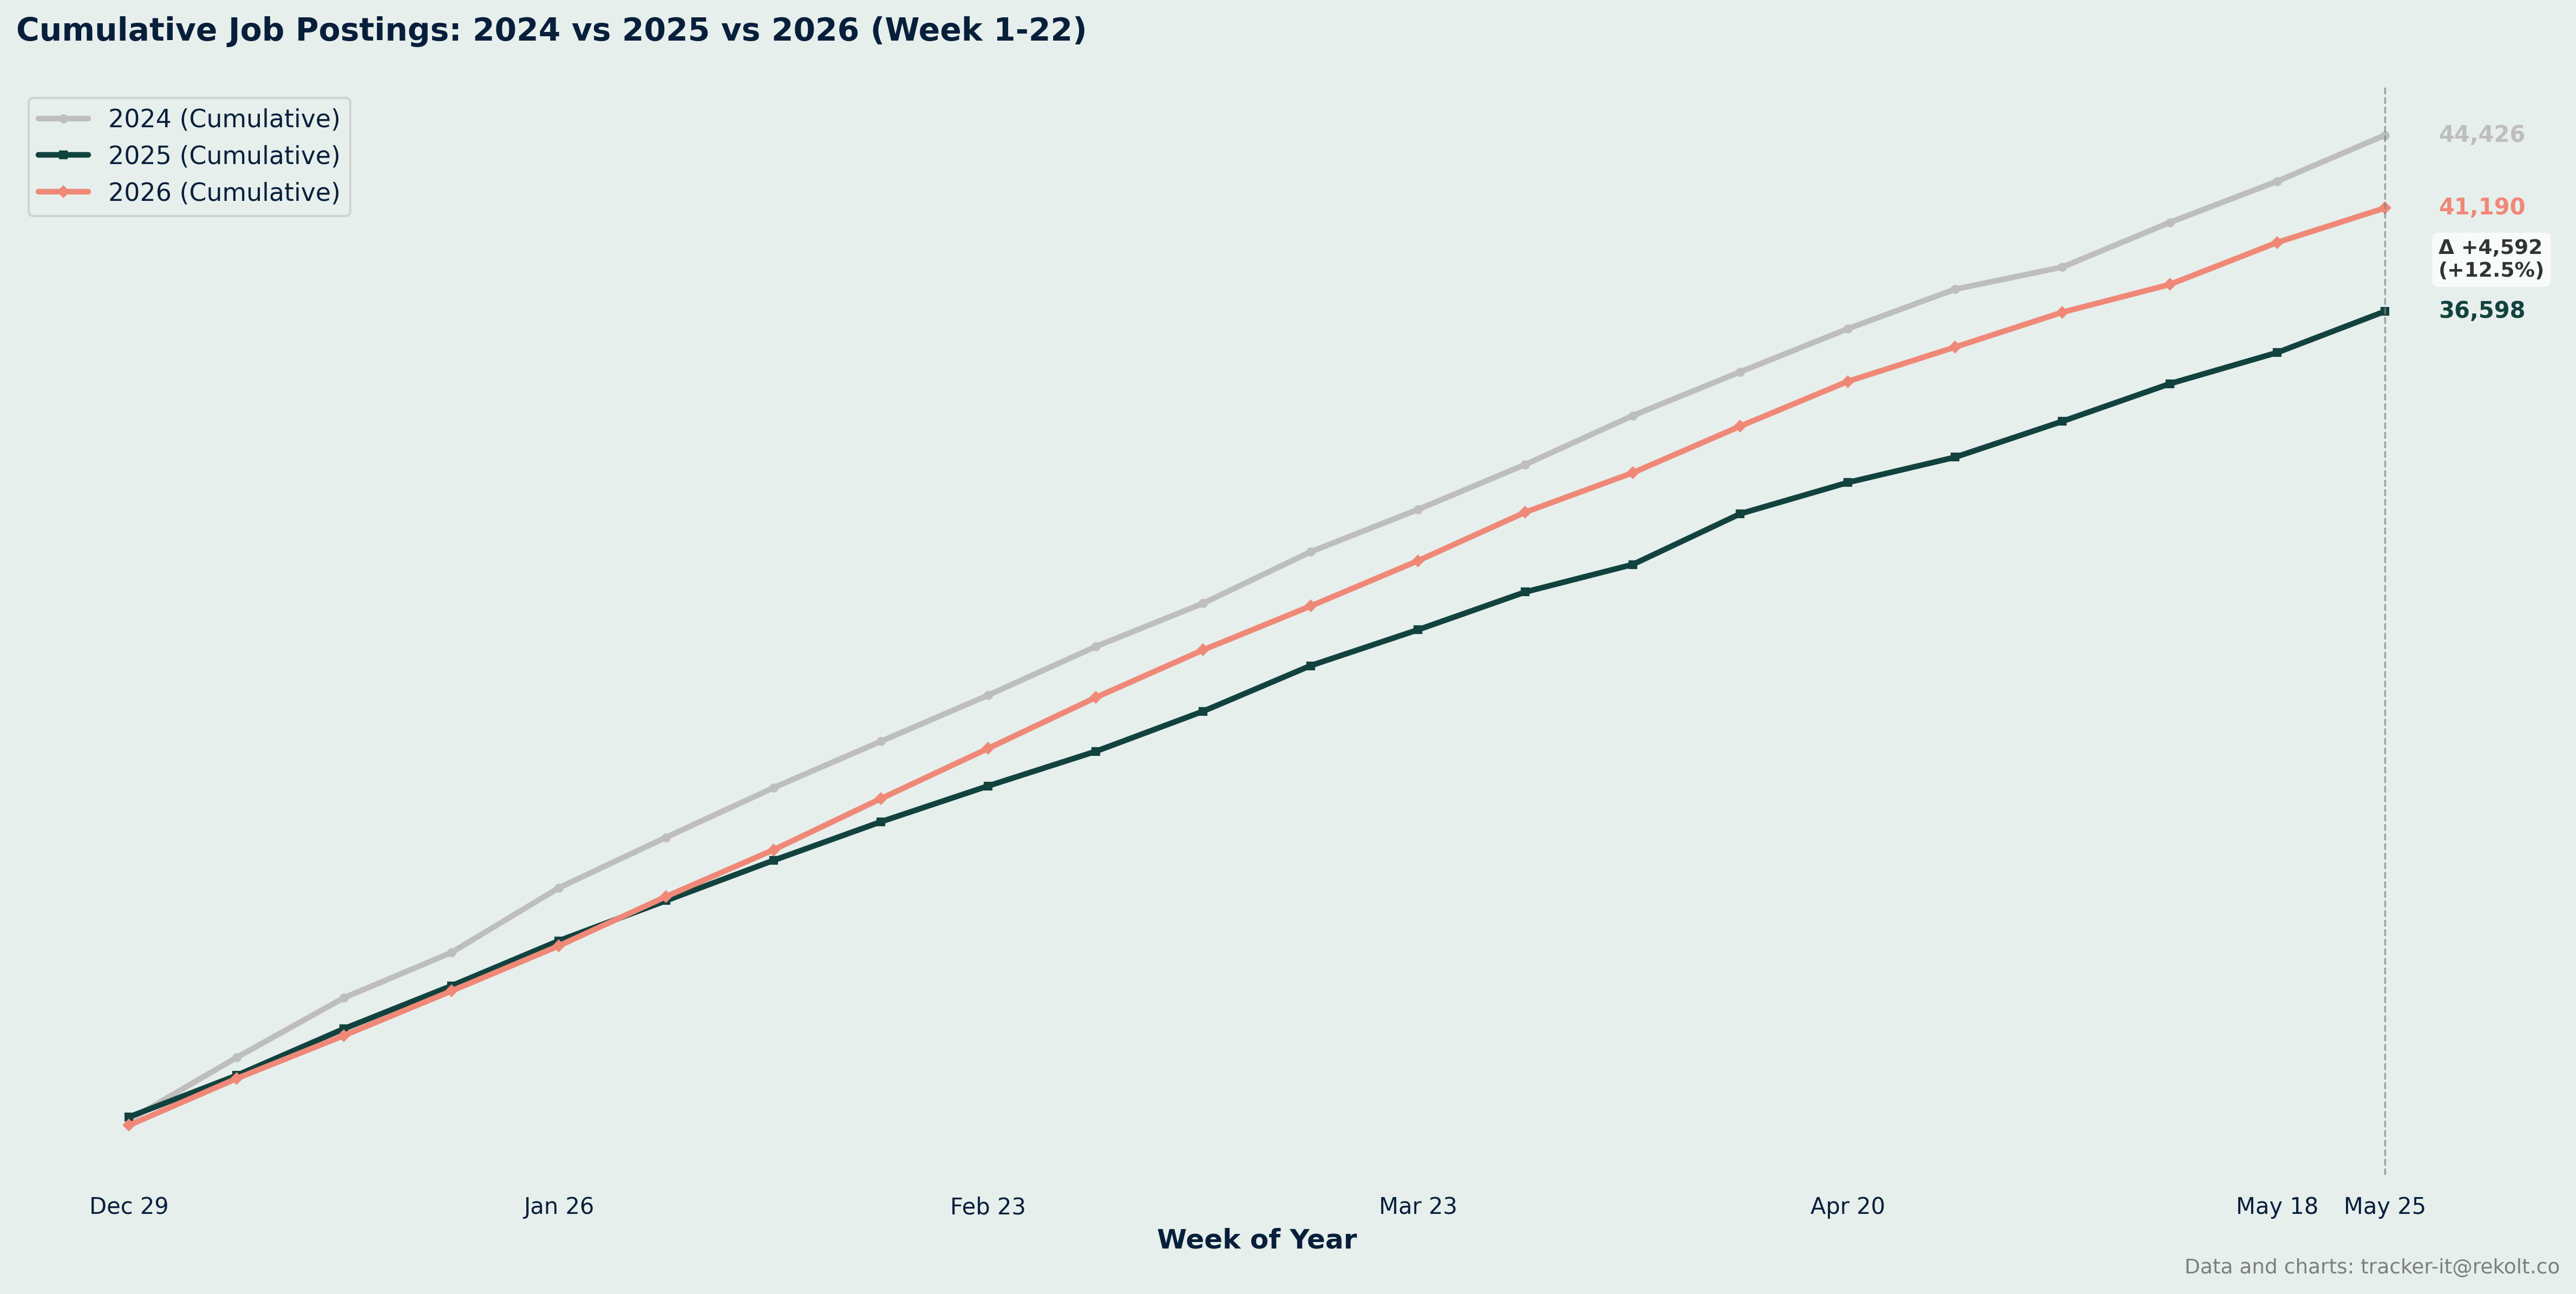
Ytd Cumlated Summary
📈 Year-over-Year Comparison (Week 22):
2025: 36598 cumulative jobs
2026: 41190 cumulative jobs
Growth: +12.5%

Note: Totals may differ slightly from the Weekly Comparison Summary. The cumulative chart starts from ISO week 1 (which can begin in late December of the prior year), while the weekly comparison skips week 1 when its Monday falls in the previous year.
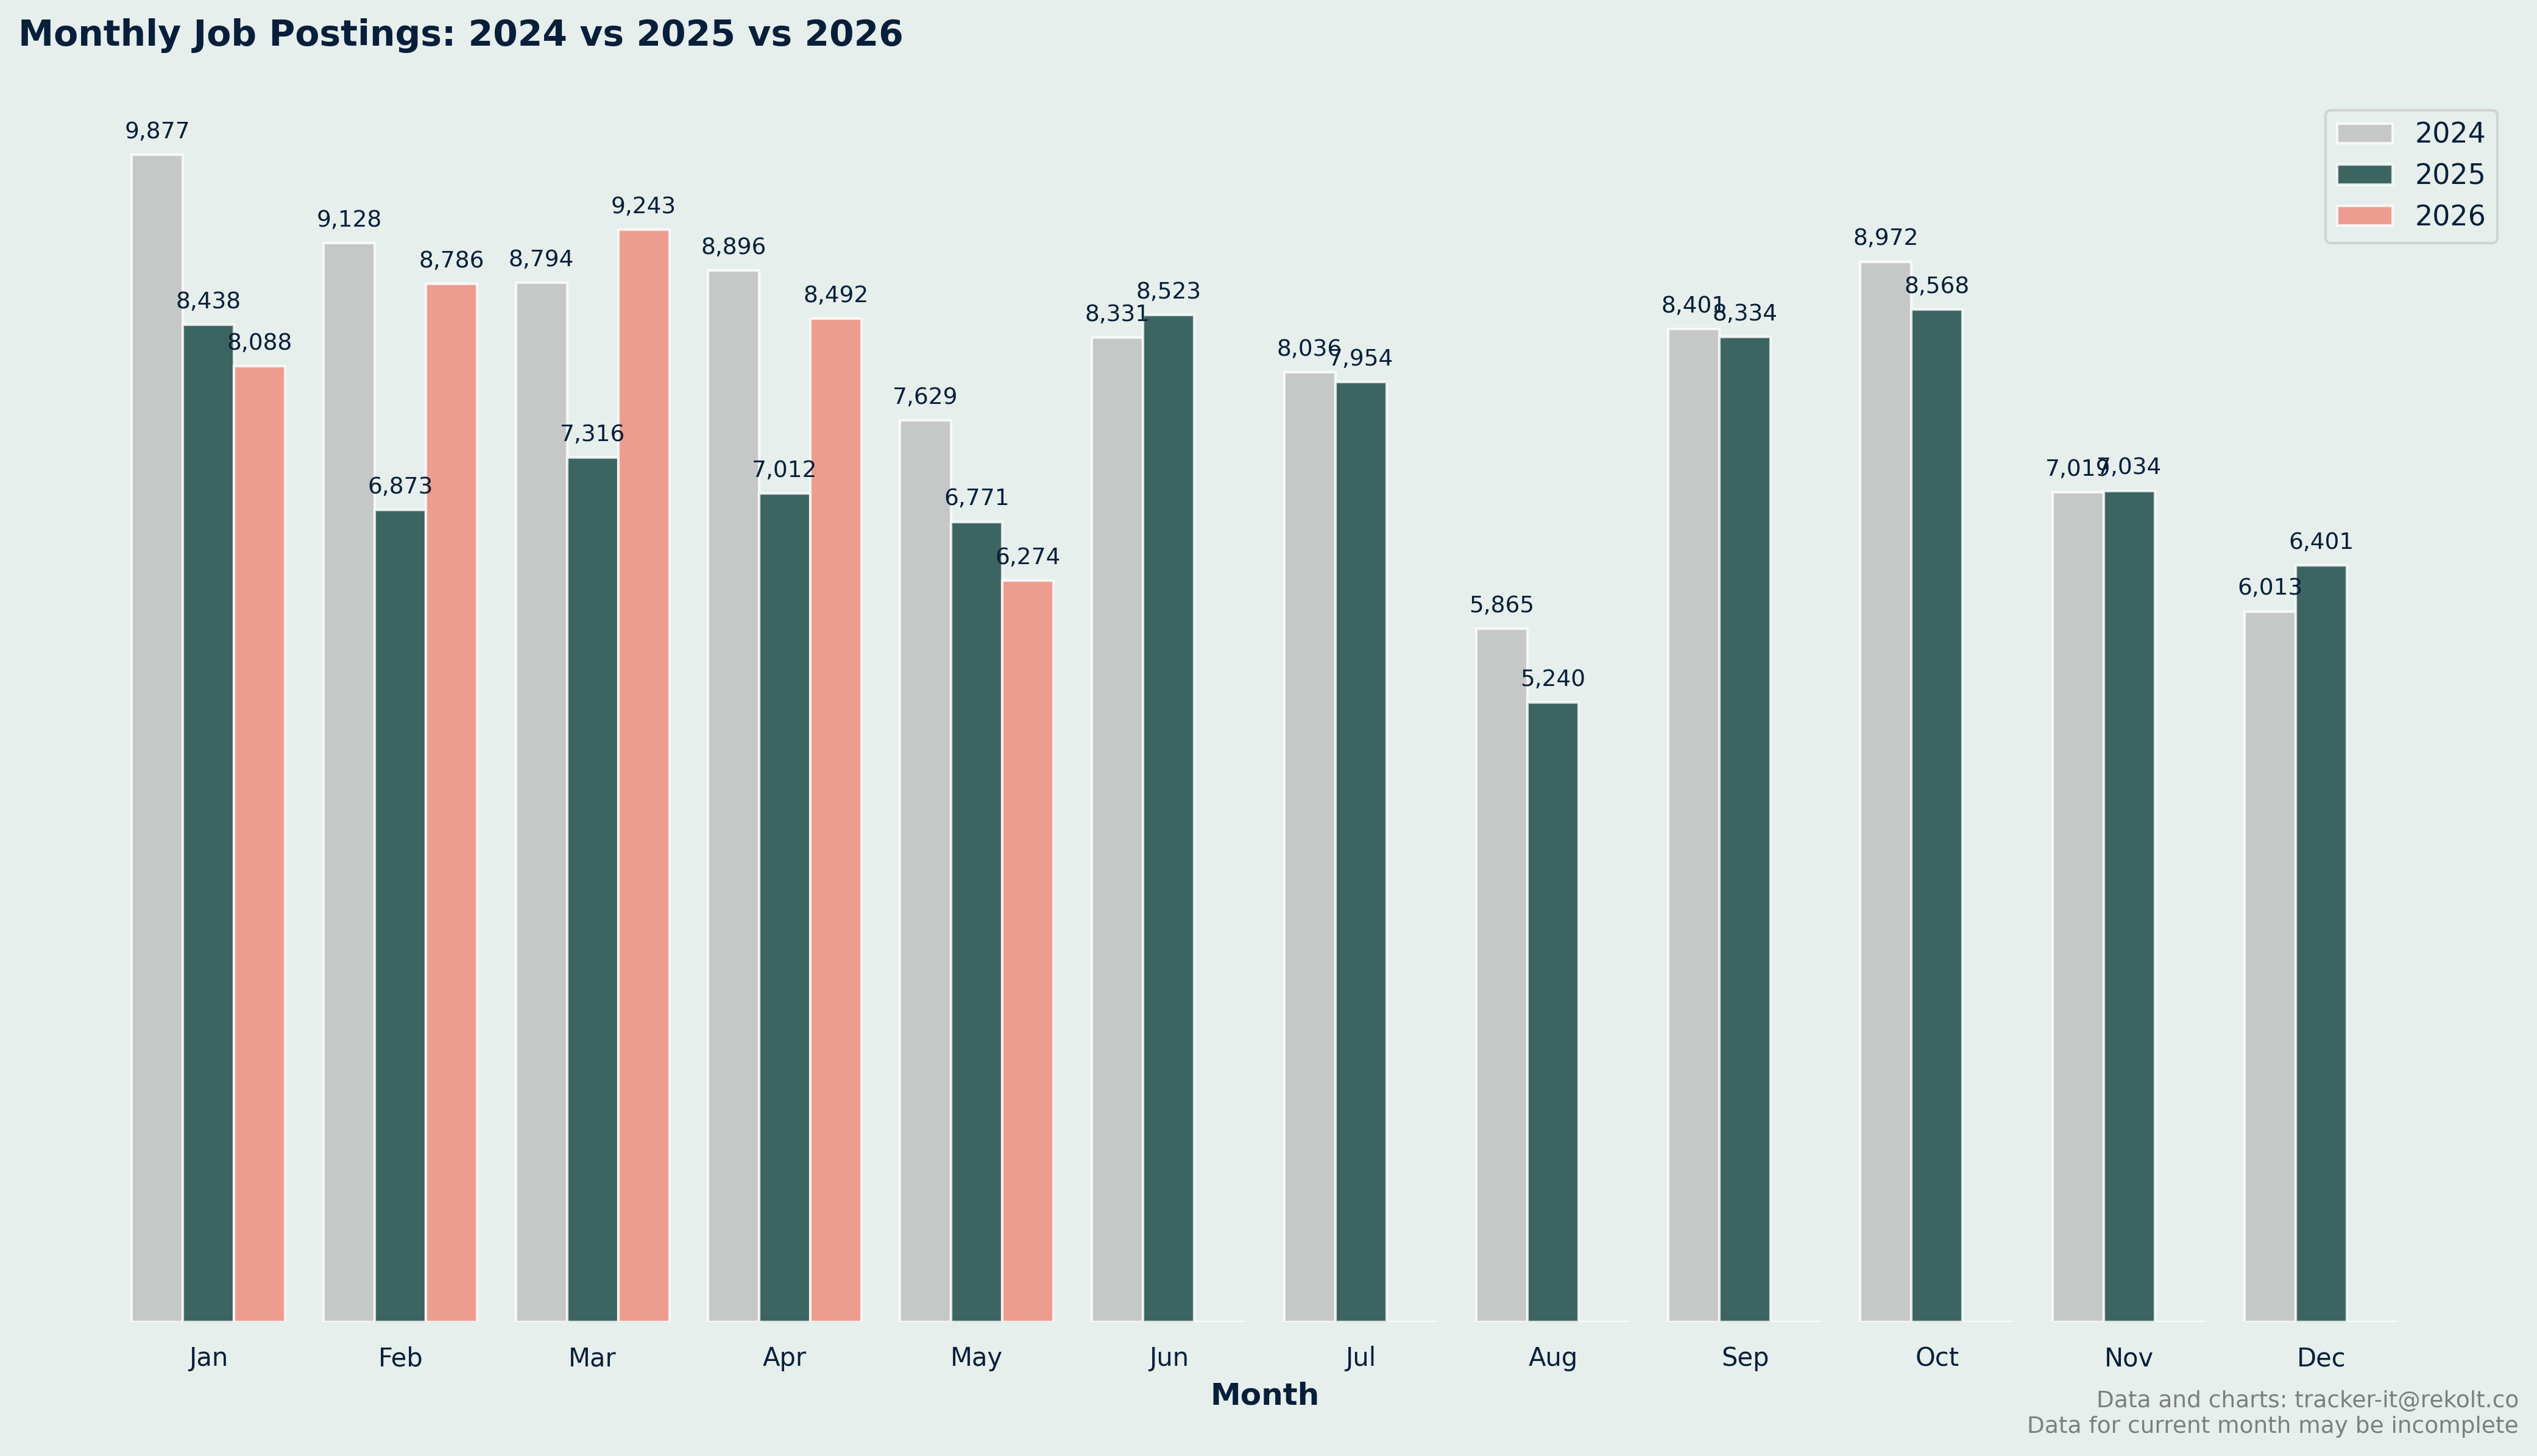
Month On Month Vs Last Year Summary
Monthly Job Postings Summary:
Jan: 2024=9877, 2025=8438, 2026=8088
Feb: 2024=9128, 2025=6873, 2026=8786
Mar: 2024=8794, 2025=7316, 2026=9243
Apr: 2024=8896, 2025=7012, 2026=8492
May: 2024=7629, 2025=6771, 2026=6274
Jun: 2024=8331, 2025=8523, 2026=  0
Jul: 2024=8036, 2025=7954, 2026=  0
Aug: 2024=5865, 2025=5240, 2026=  0
Sep: 2024=8401, 2025=8334, 2026=  0
Oct: 2024=8972, 2025=8568, 2026=  0
Nov: 2024=7019, 2025=7034, 2026=  0
Dec: 2024=6013, 2025=6401, 2026=  0
Remote Vs Onsite Percentage Summary
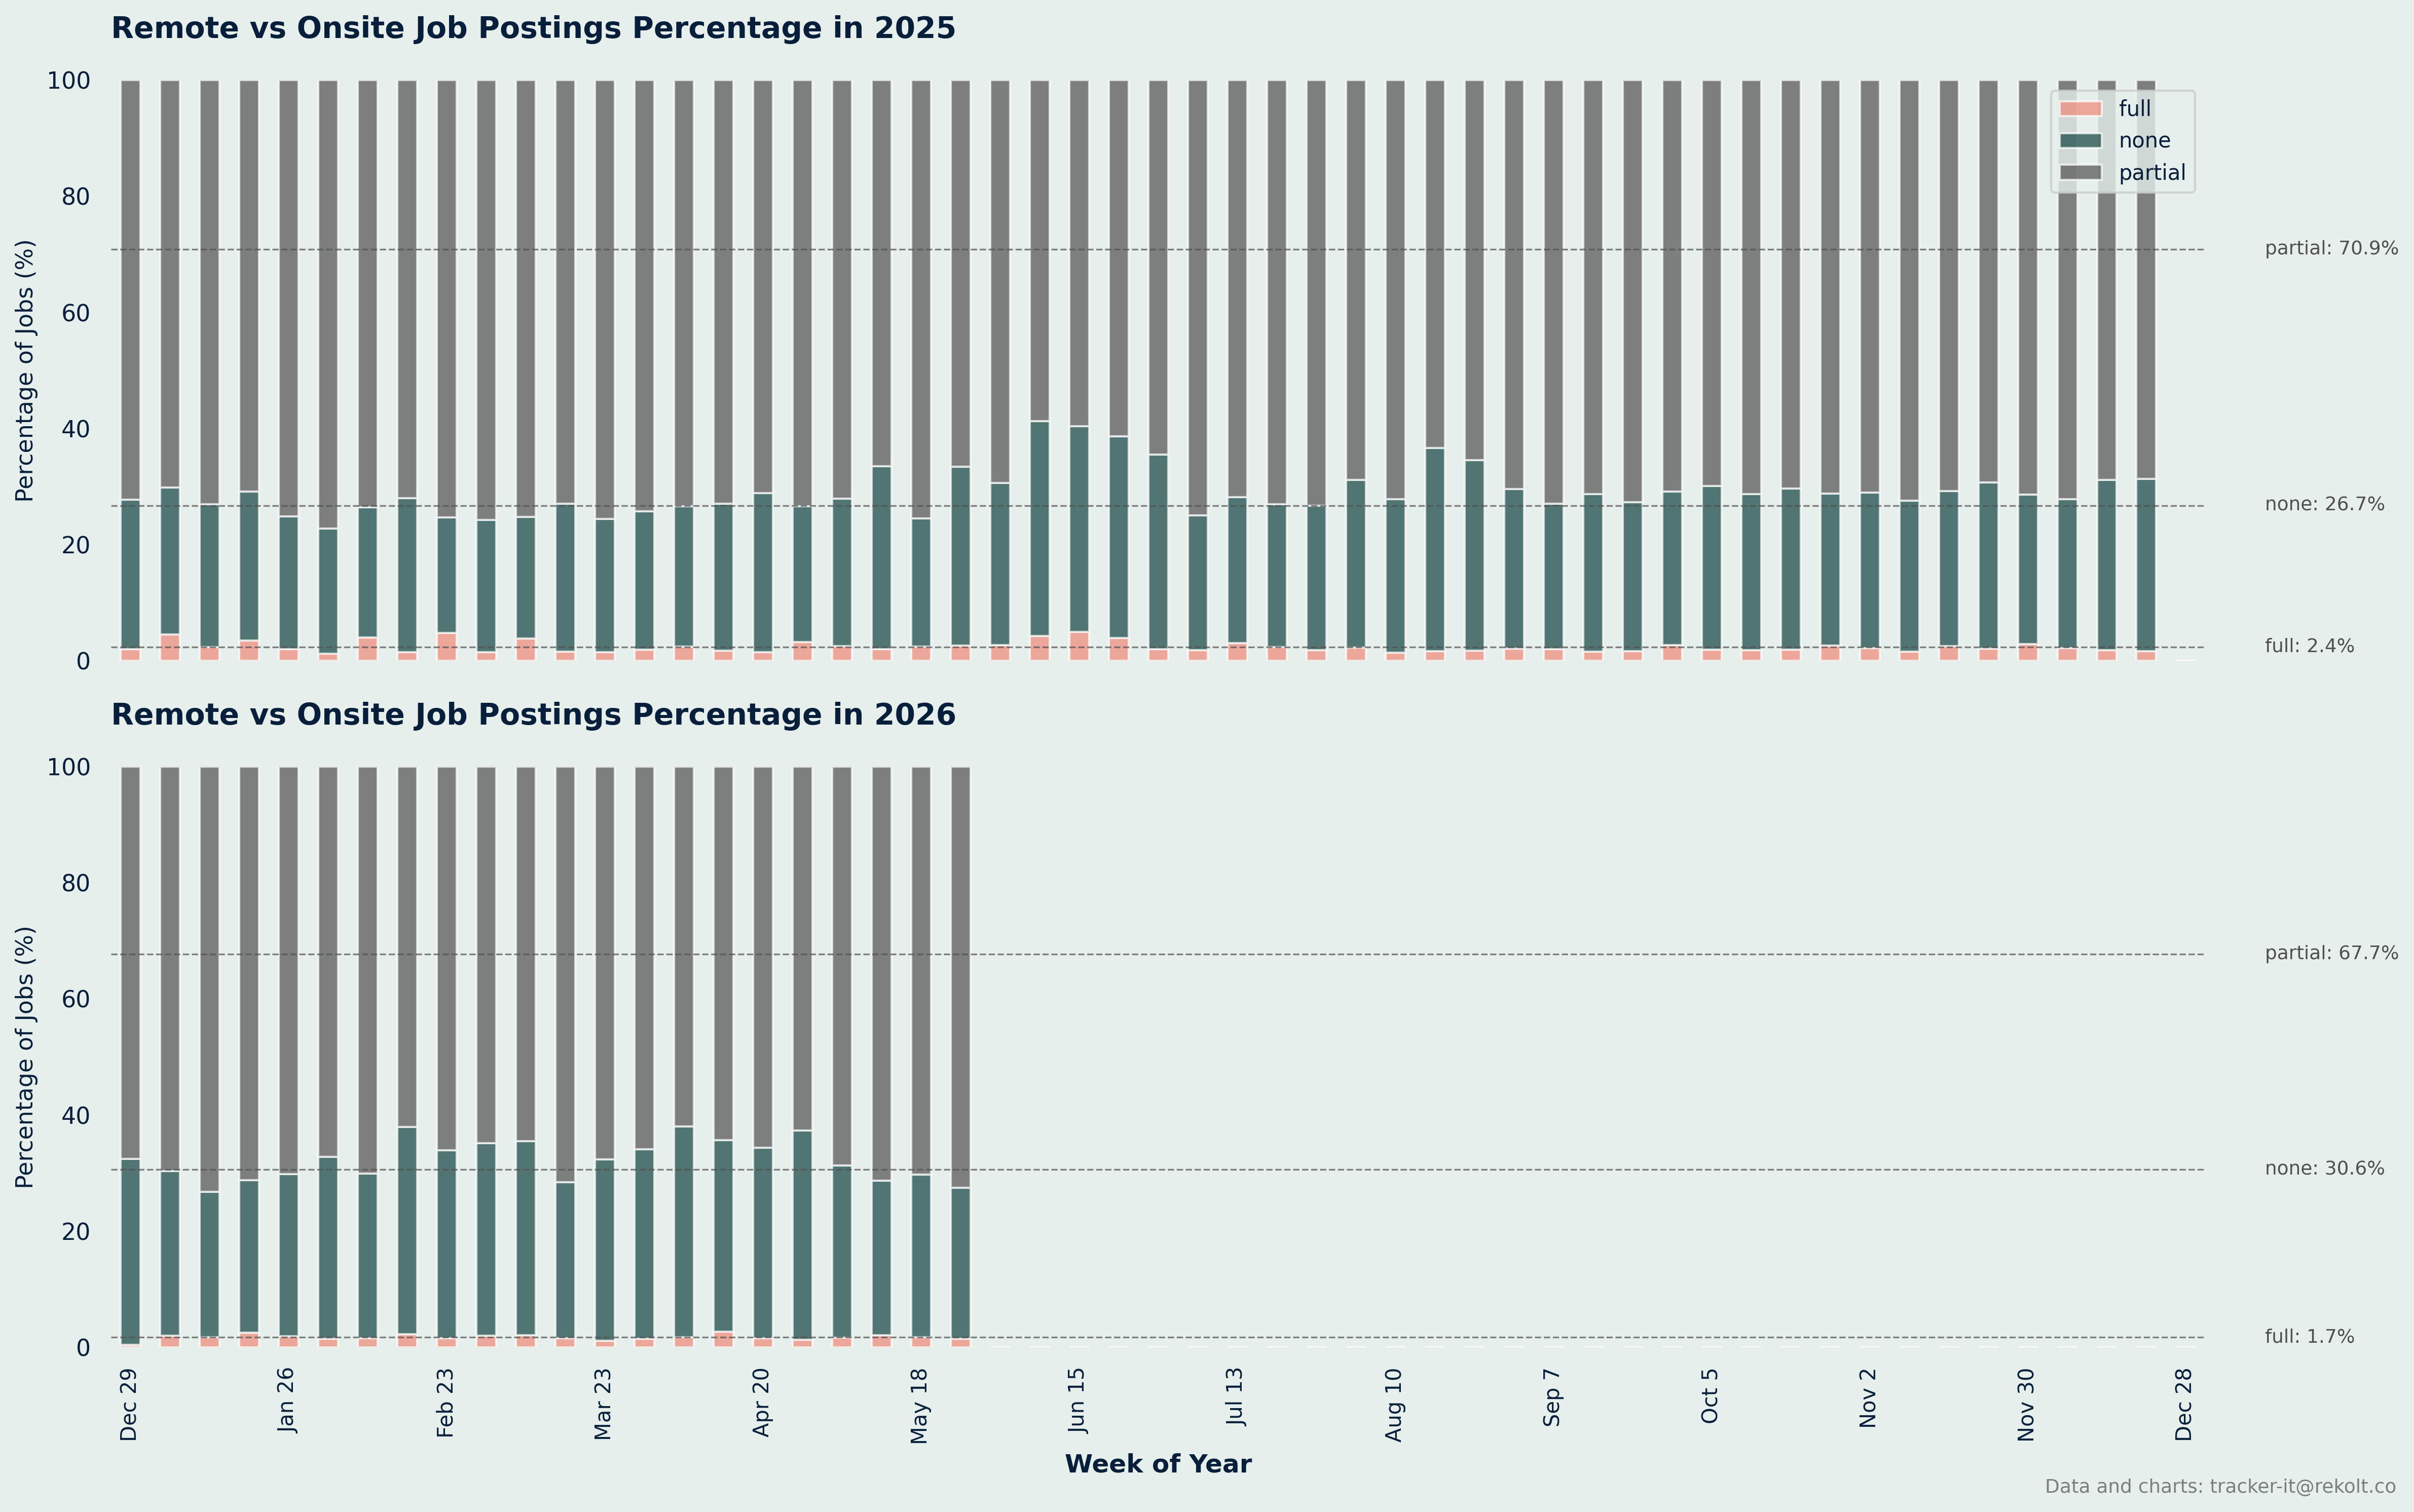
Remote vs Onsite Job Postings Percentage Summary:
2025: 5200 total pct-weeks
	 full: avg 2.4% per week
	 none: avg 26.7% per week
	 partial: avg 70.9% per week
2026: 2200 total pct-weeks
	 full: avg 1.7% per week
	 none: avg 30.6% per week
	 partial: avg 67.7% per week
Experience Level Summary
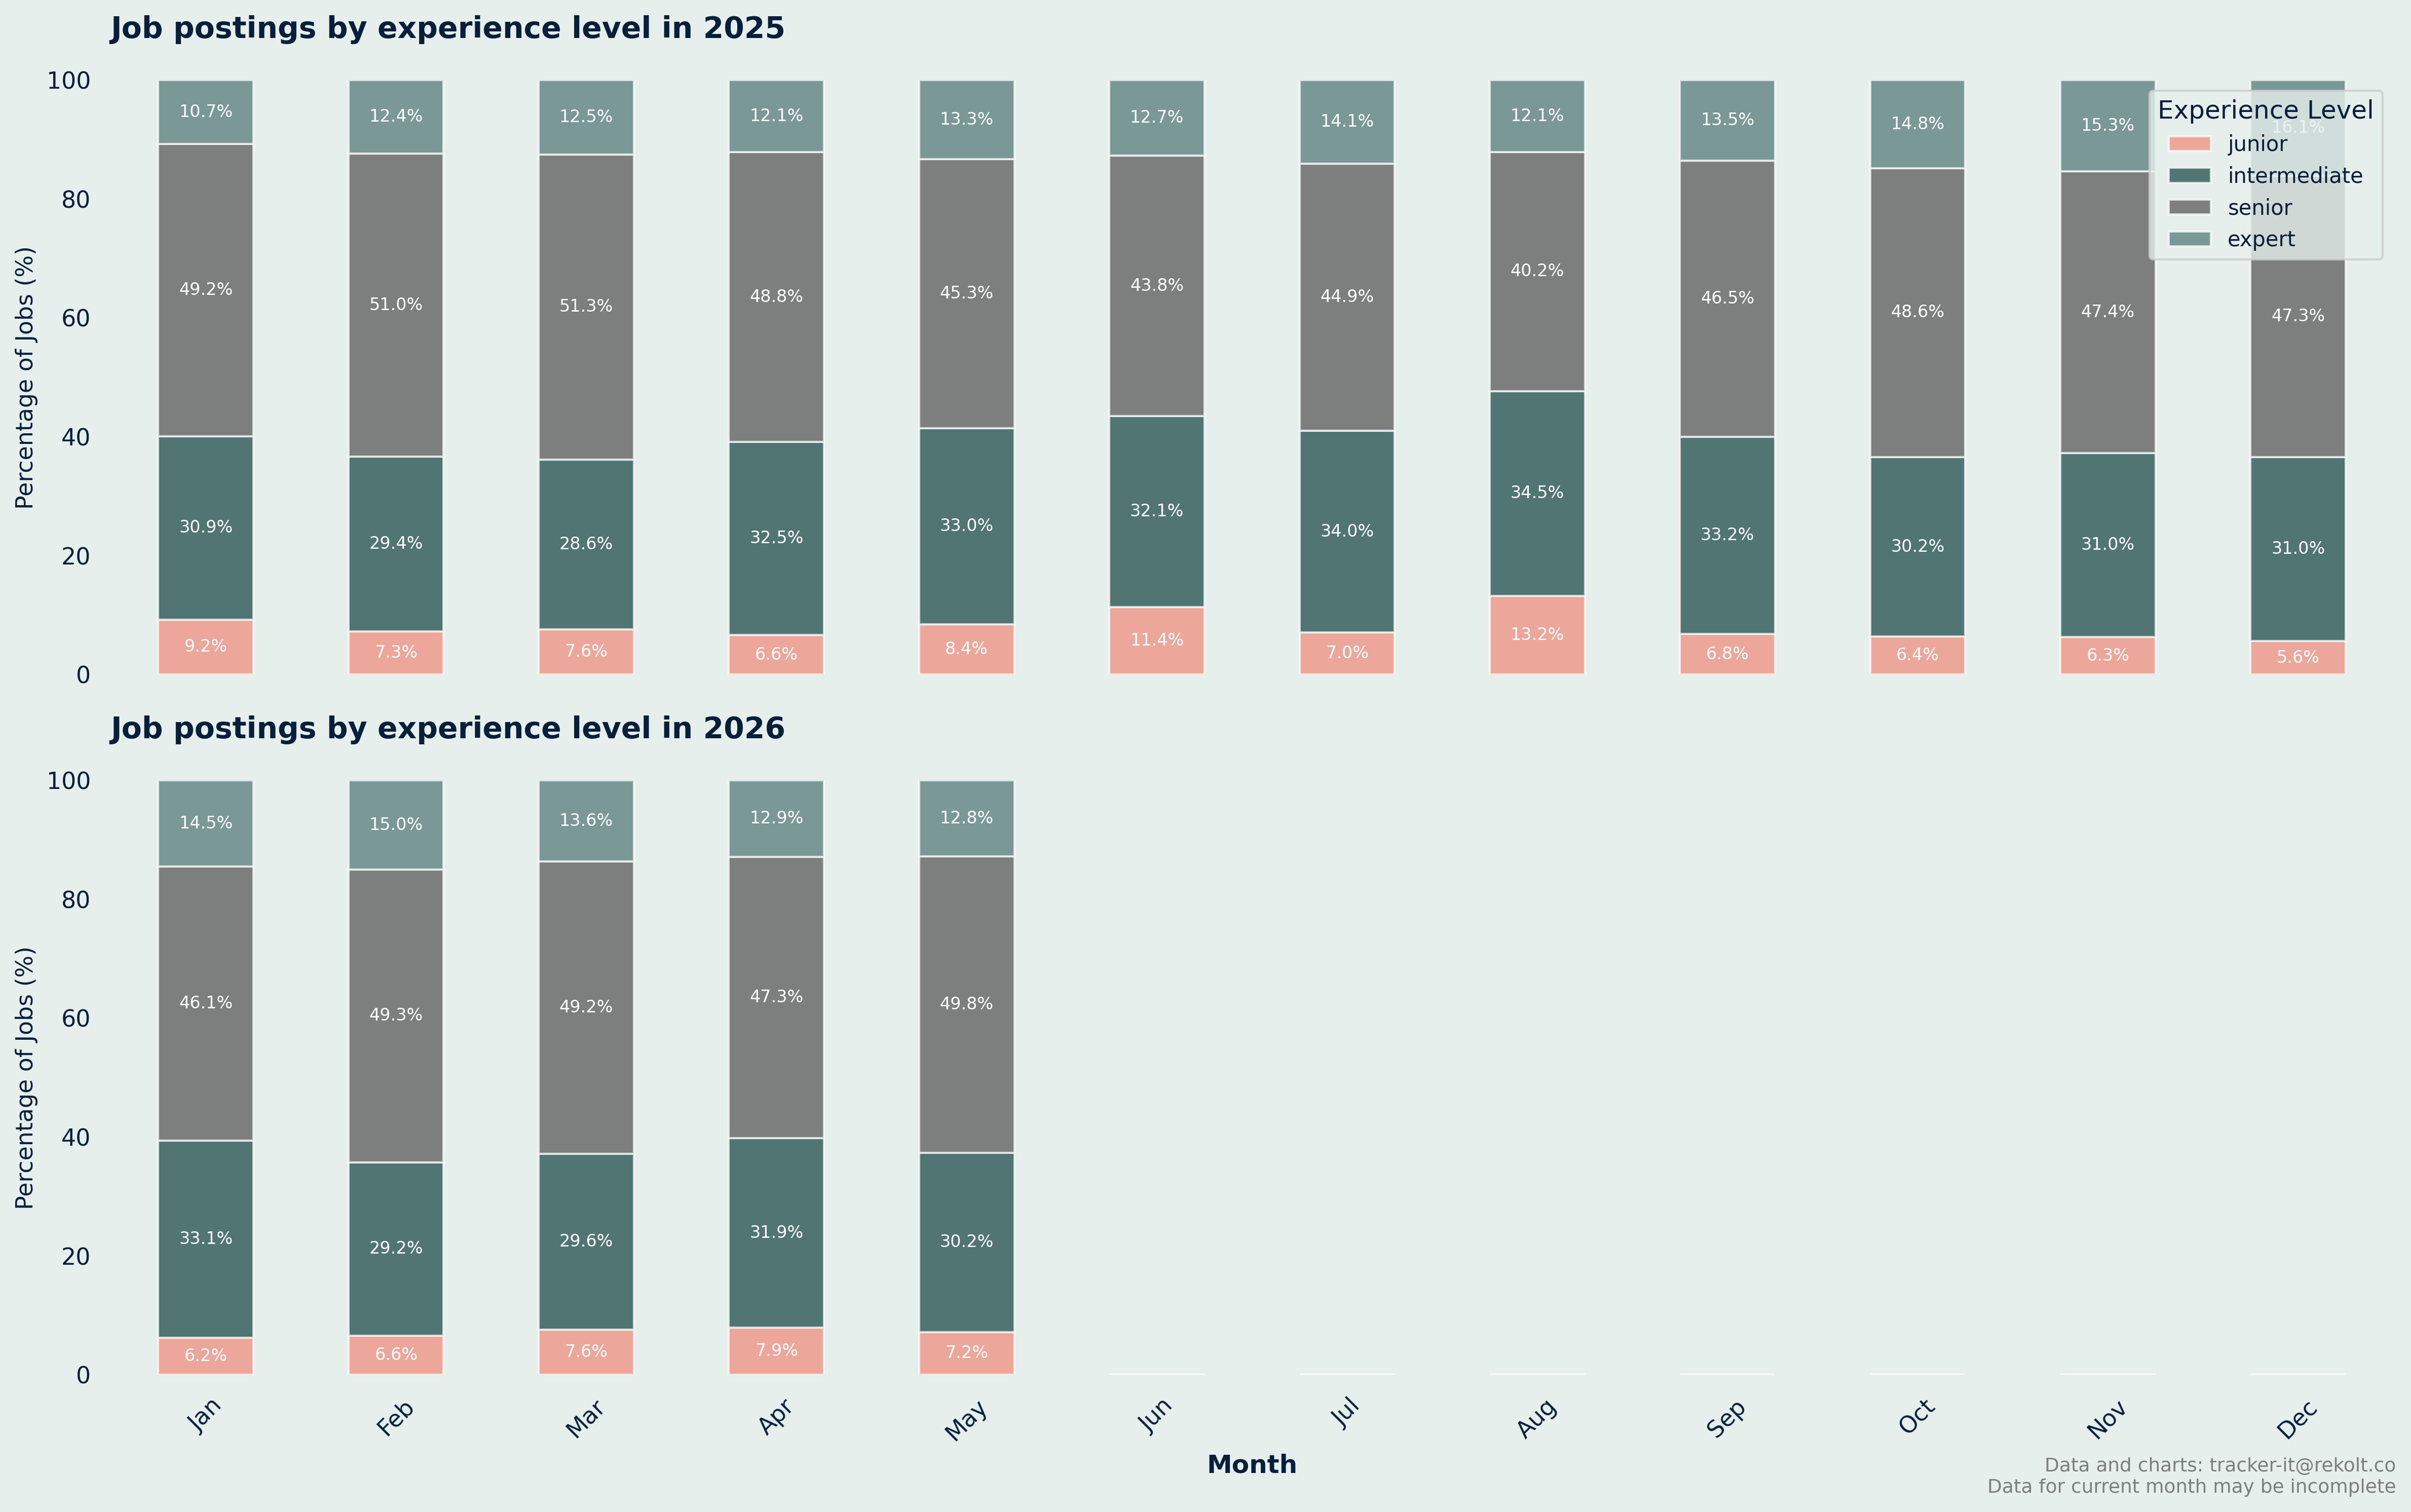
 Monthly Job Postings by Experience Level Summary:
2025:
	 Junior: 6802 jobs (7.9%)
	 Intermediate: 27232 jobs (31.6%)
	 Senior: 40621 jobs (47.2%)
	 Expert: 11427 jobs (13.3%)
2026:
	 Junior: 2658 jobs (7.1%)
	 Intermediate: 11553 jobs (30.8%)
	 Senior: 18118 jobs (48.3%)
	 Expert: 5178 jobs (13.8%)
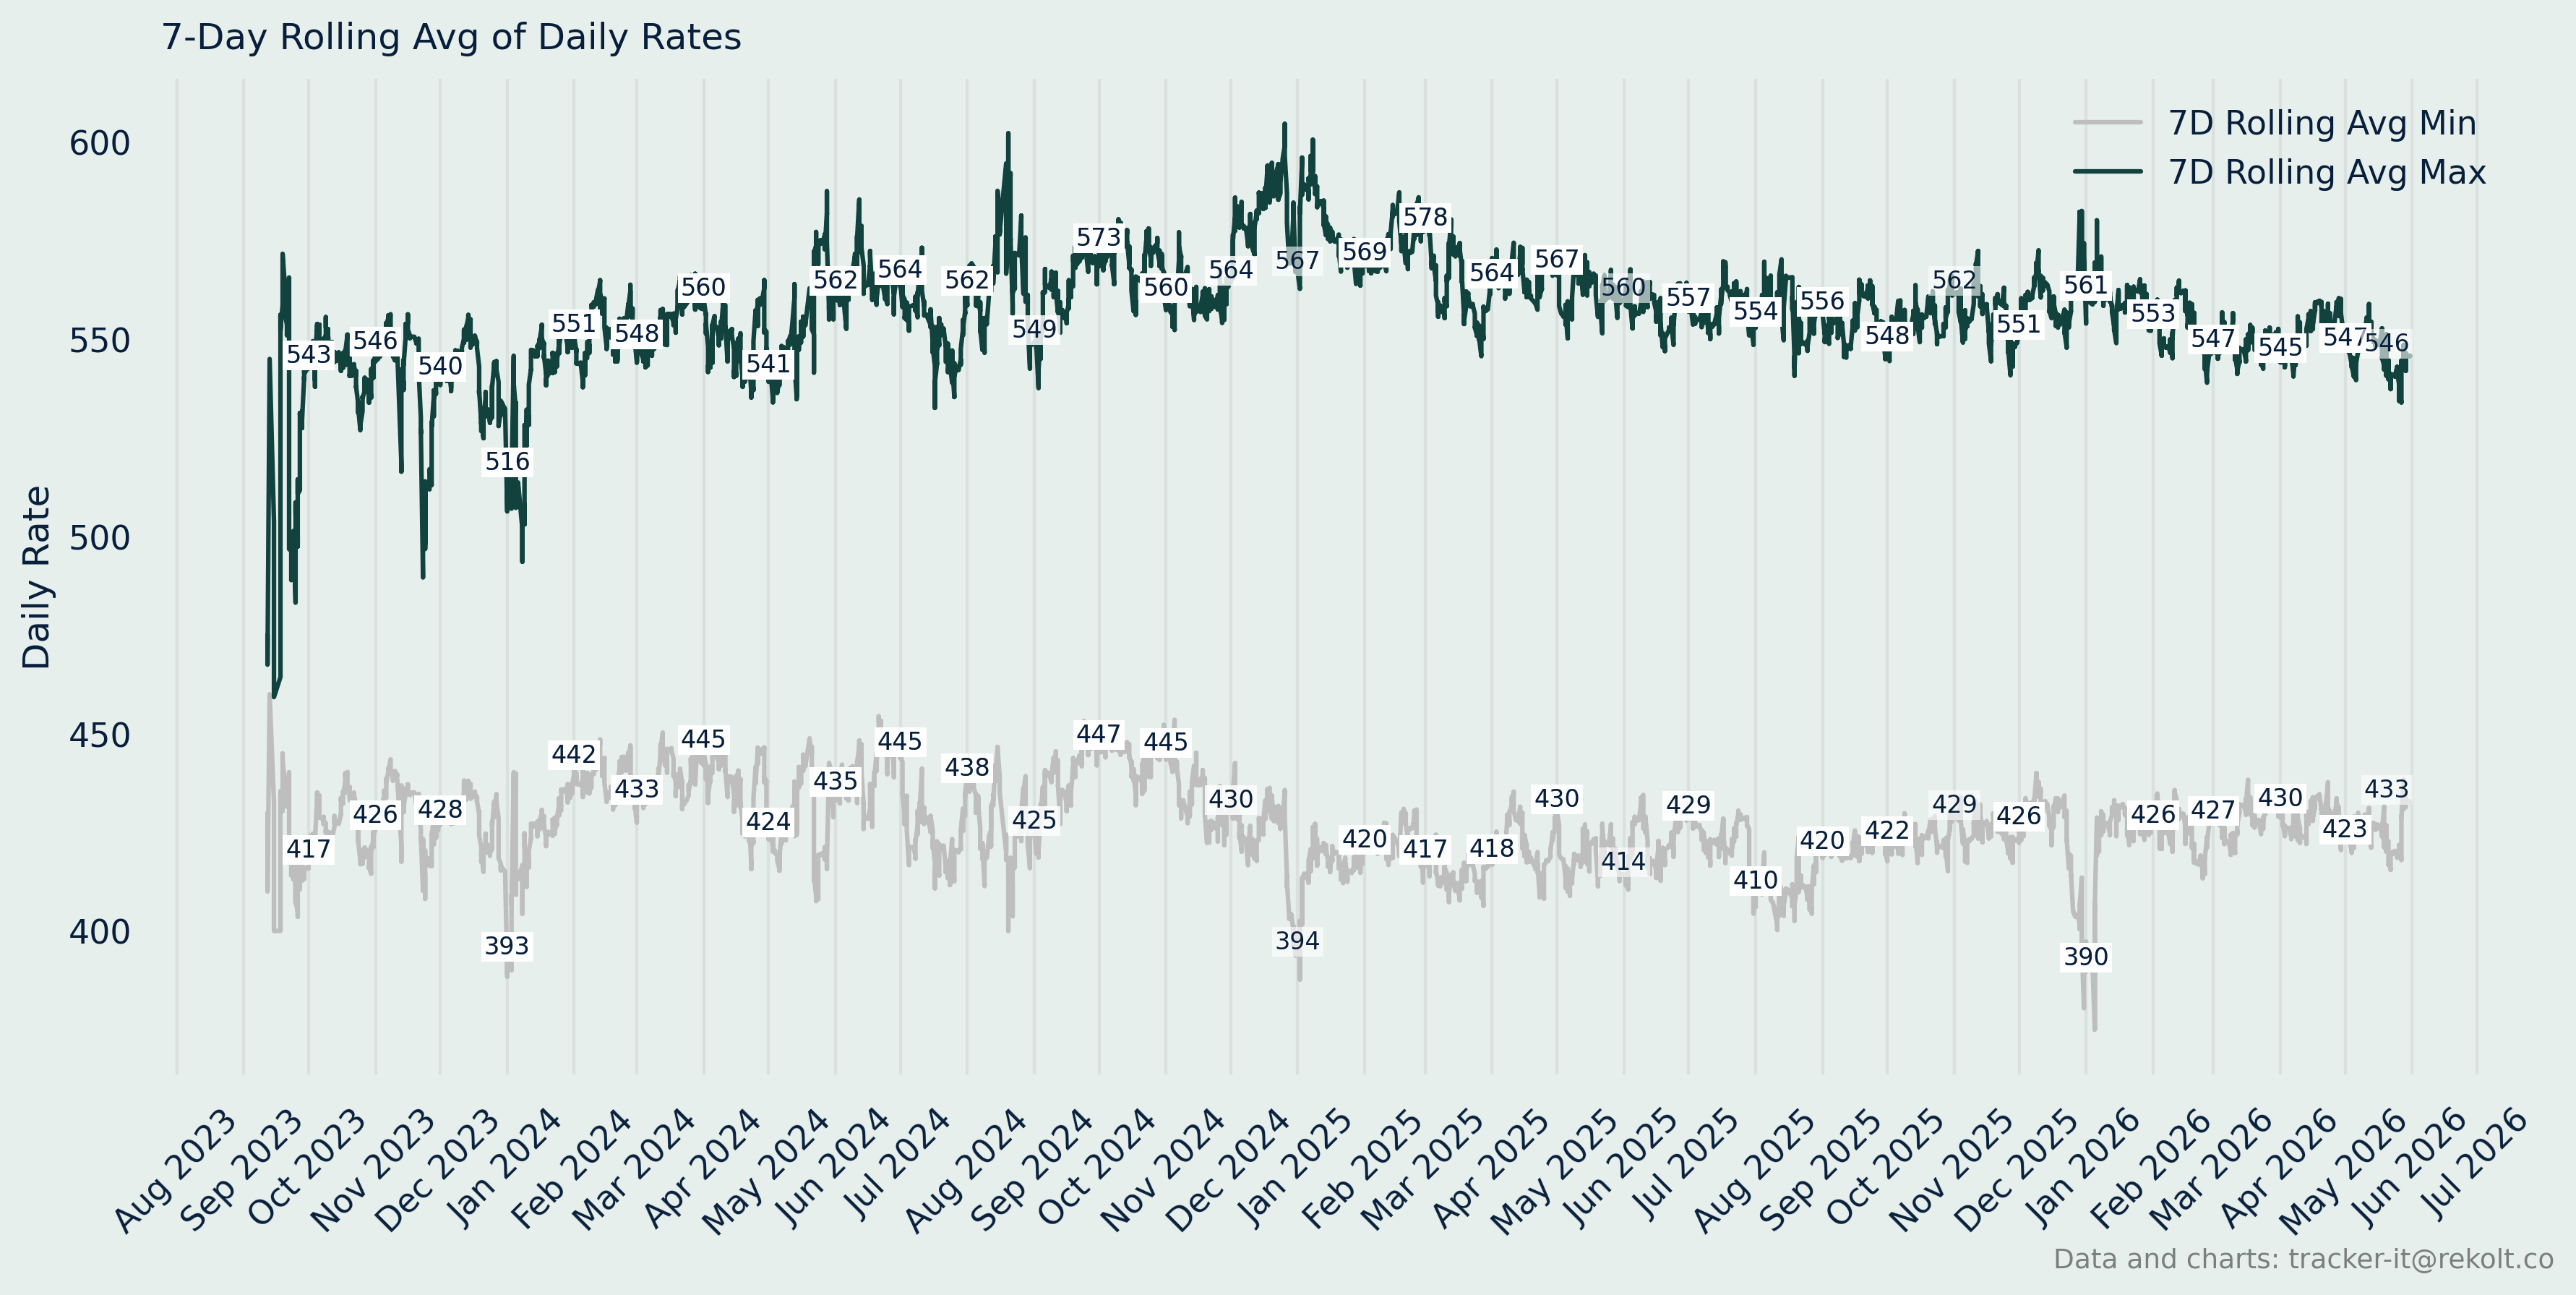
Annual Salary Summary
 Daily Rate Summary:
2023:
	 Average min daily rate: 428
	 Average max daily rate: 543

2024:
	 Average min daily rate: 434
	 Average max daily rate: 560

2025:
	 Average min daily rate: 421
	 Average max daily rate: 561

2026:
	 Average min daily rate: 427
	 Average max daily rate: 552