Freelance Tracker
Weekly Job Postings Summary
Every week, we deliver a comprehensive analysis of the French IT freelance landscape.
This report includes insights on job postings, remote work trends, salary analysis, and more.
- We maintain a backlog of analysis ideas. Send yours to tracker-it@rekolt.co.
- Join our telegram channel for weekly updates and for occasional REKOLT project briefs and mission descriptions.
report for week starting October 20, 2025
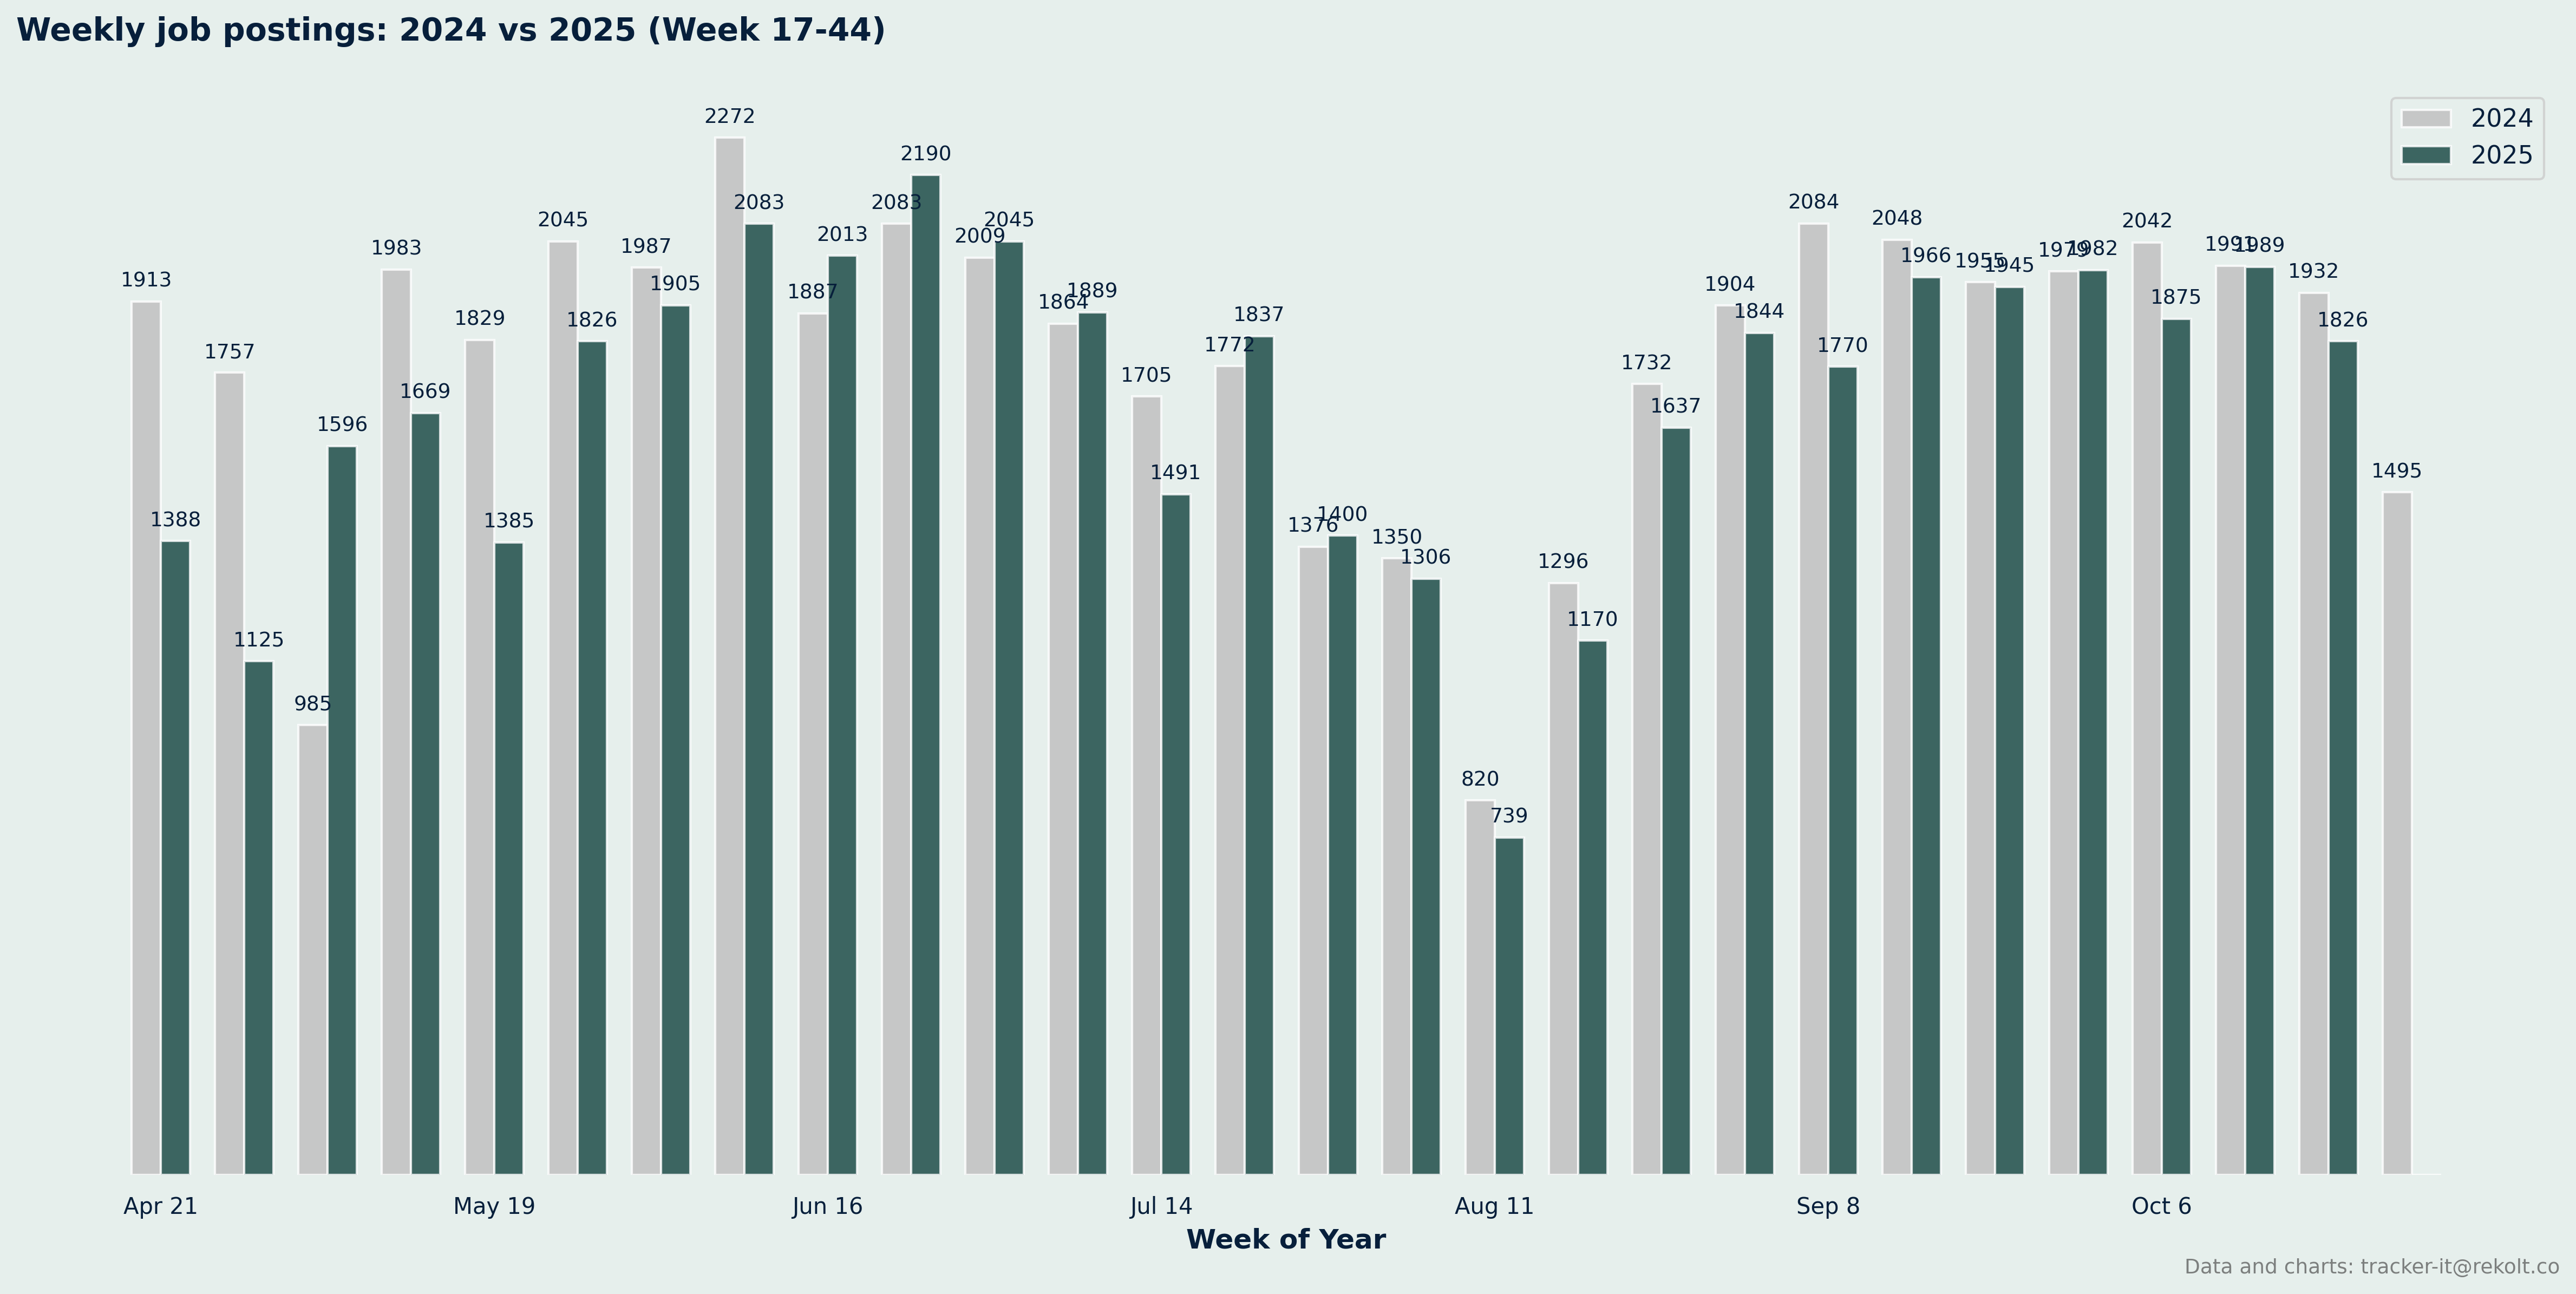
Weekly Vs Last Year Summary
📈 Comparison Summary
2025: 27 weeks, 45891 total jobs, avg 1700 jobs/week
2024: 27 weeks, 48600 total jobs, avg 1800 jobs/week
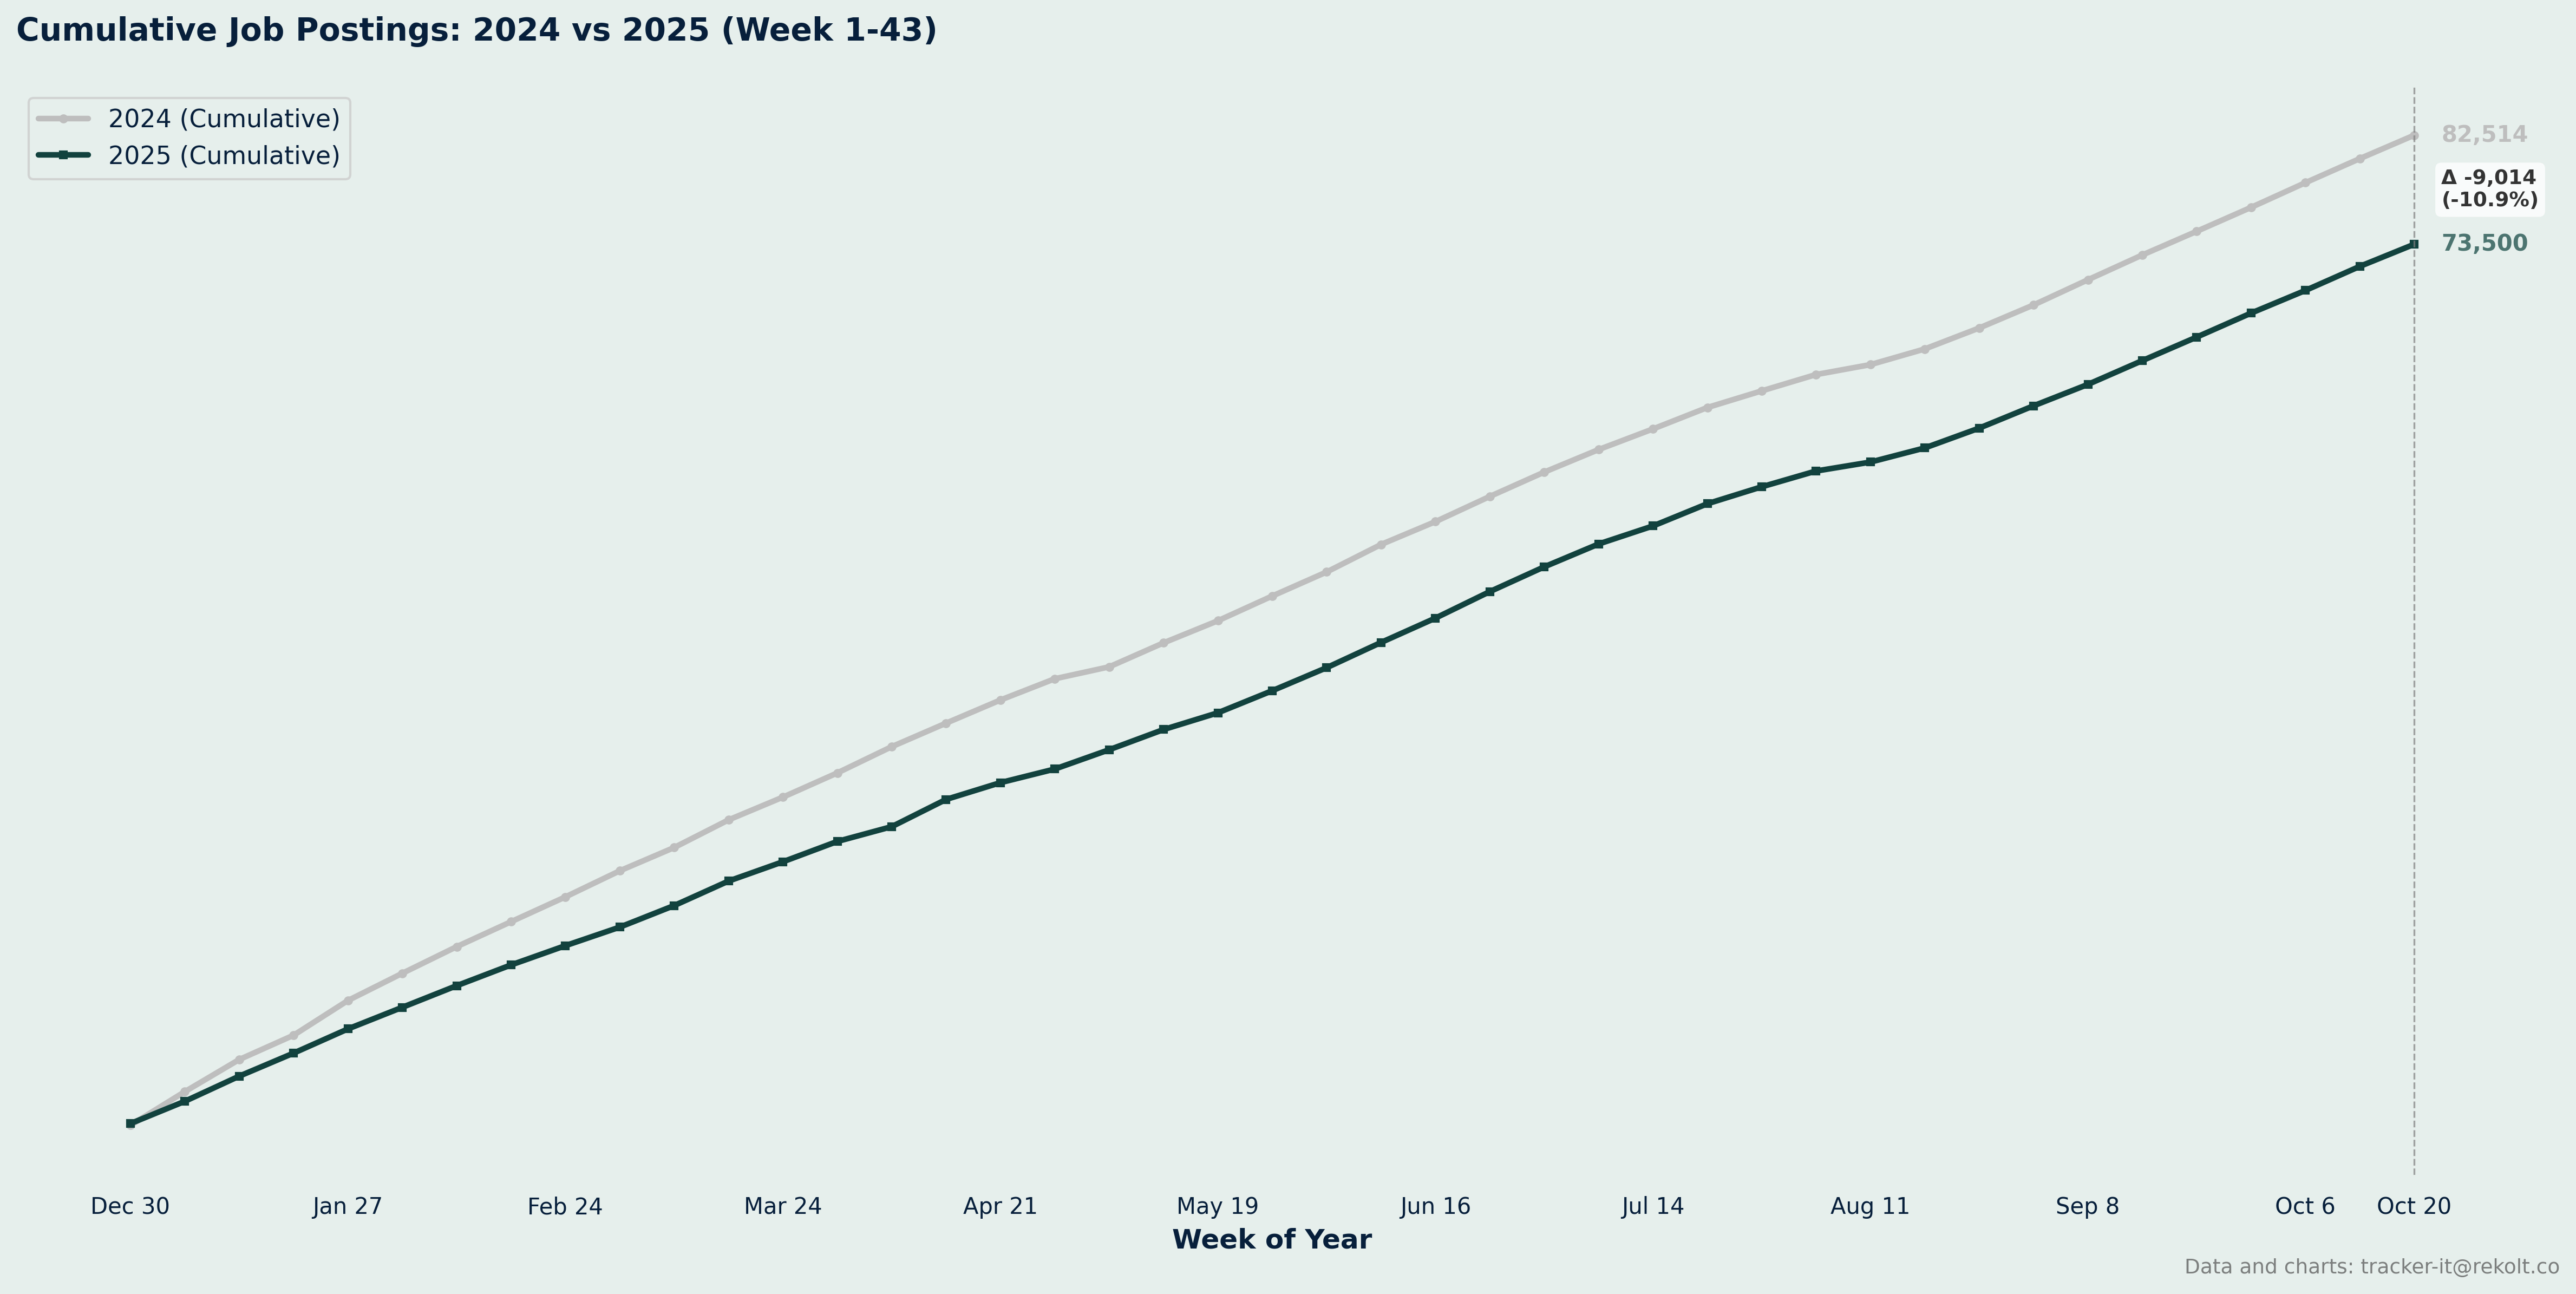
Ytd Cumlated Summary
📈 Year-over-Year Comparison (Week 43):
2024: 82514 cumulative jobs
2025: 73500 cumulative jobs
Growth: -10.9%
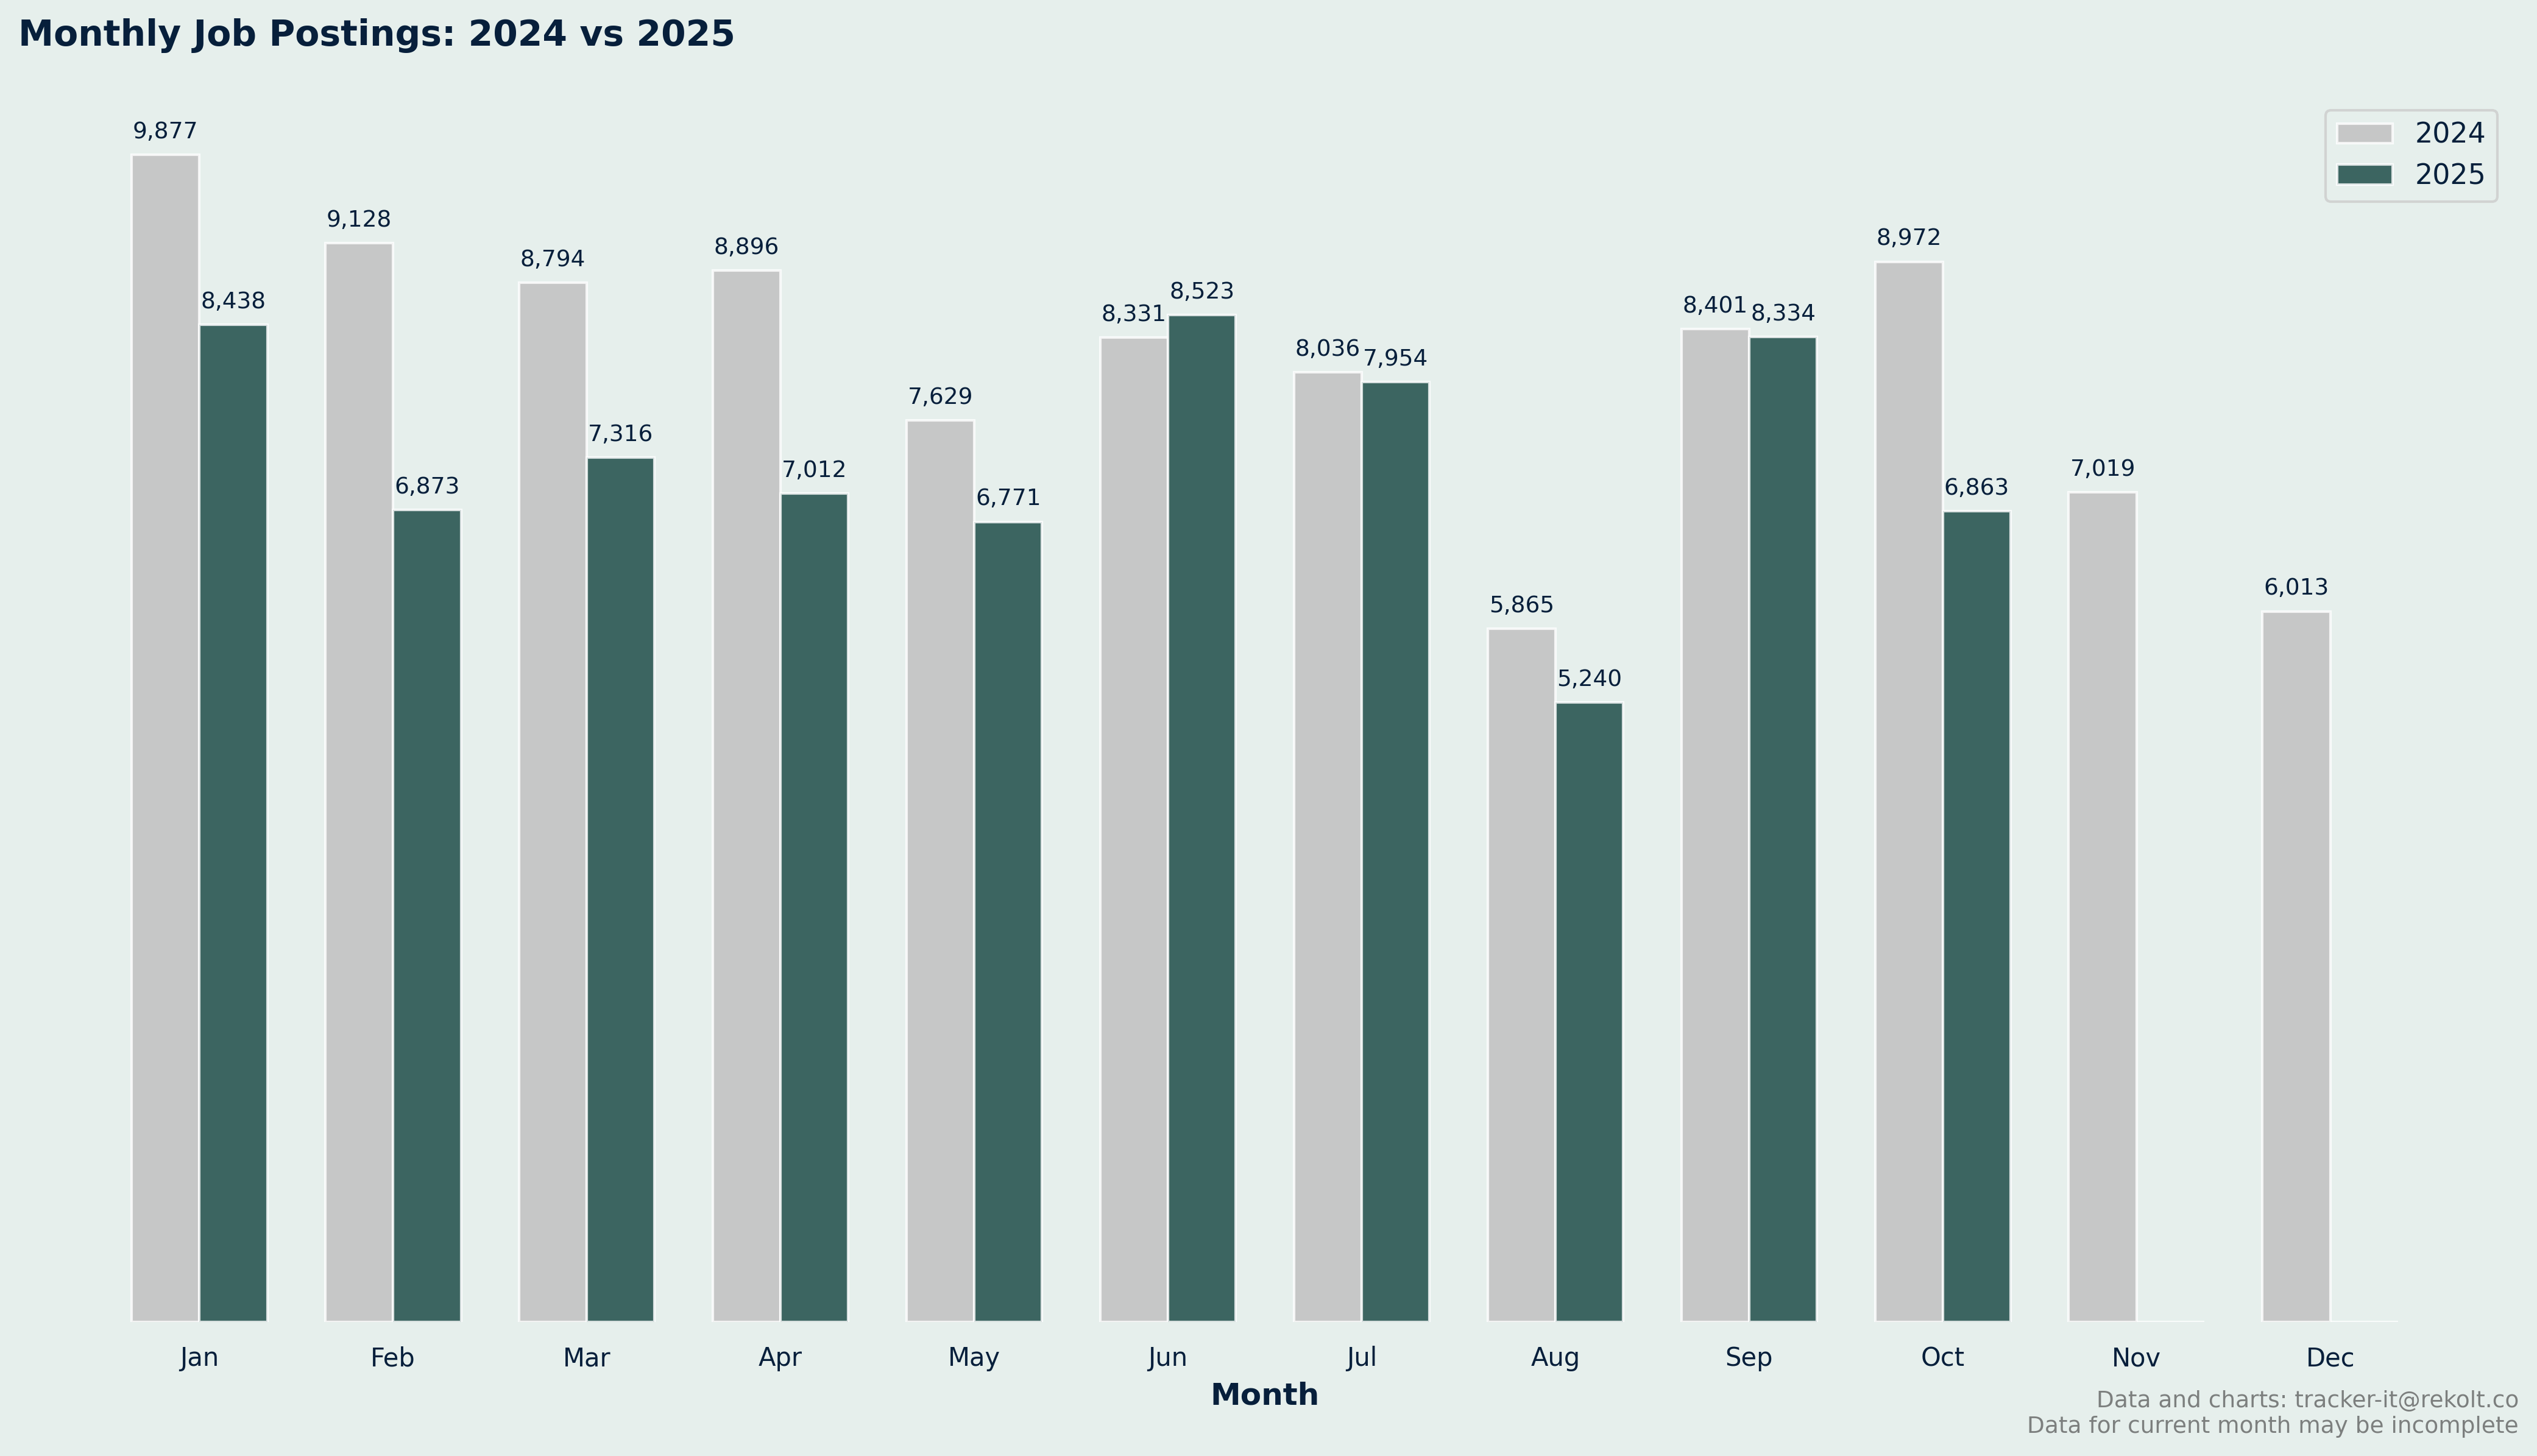
Month On Month Vs Last Year Summary
📊 Monthly Job Postings Summary:
Jan: 2024=9877, 2025=8438
Feb: 2024=9128, 2025=6873
Mar: 2024=8794, 2025=7316
Apr: 2024=8896, 2025=7012
May: 2024=7629, 2025=6771
Jun: 2024=8331, 2025=8523
Jul: 2024=8036, 2025=7954
Aug: 2024=5865, 2025=5240
Sep: 2024=8401, 2025=8334
Oct: 2024=8972, 2025=6863
Nov: 2024=7019, 2025=  0
Dec: 2024=6013, 2025=  0
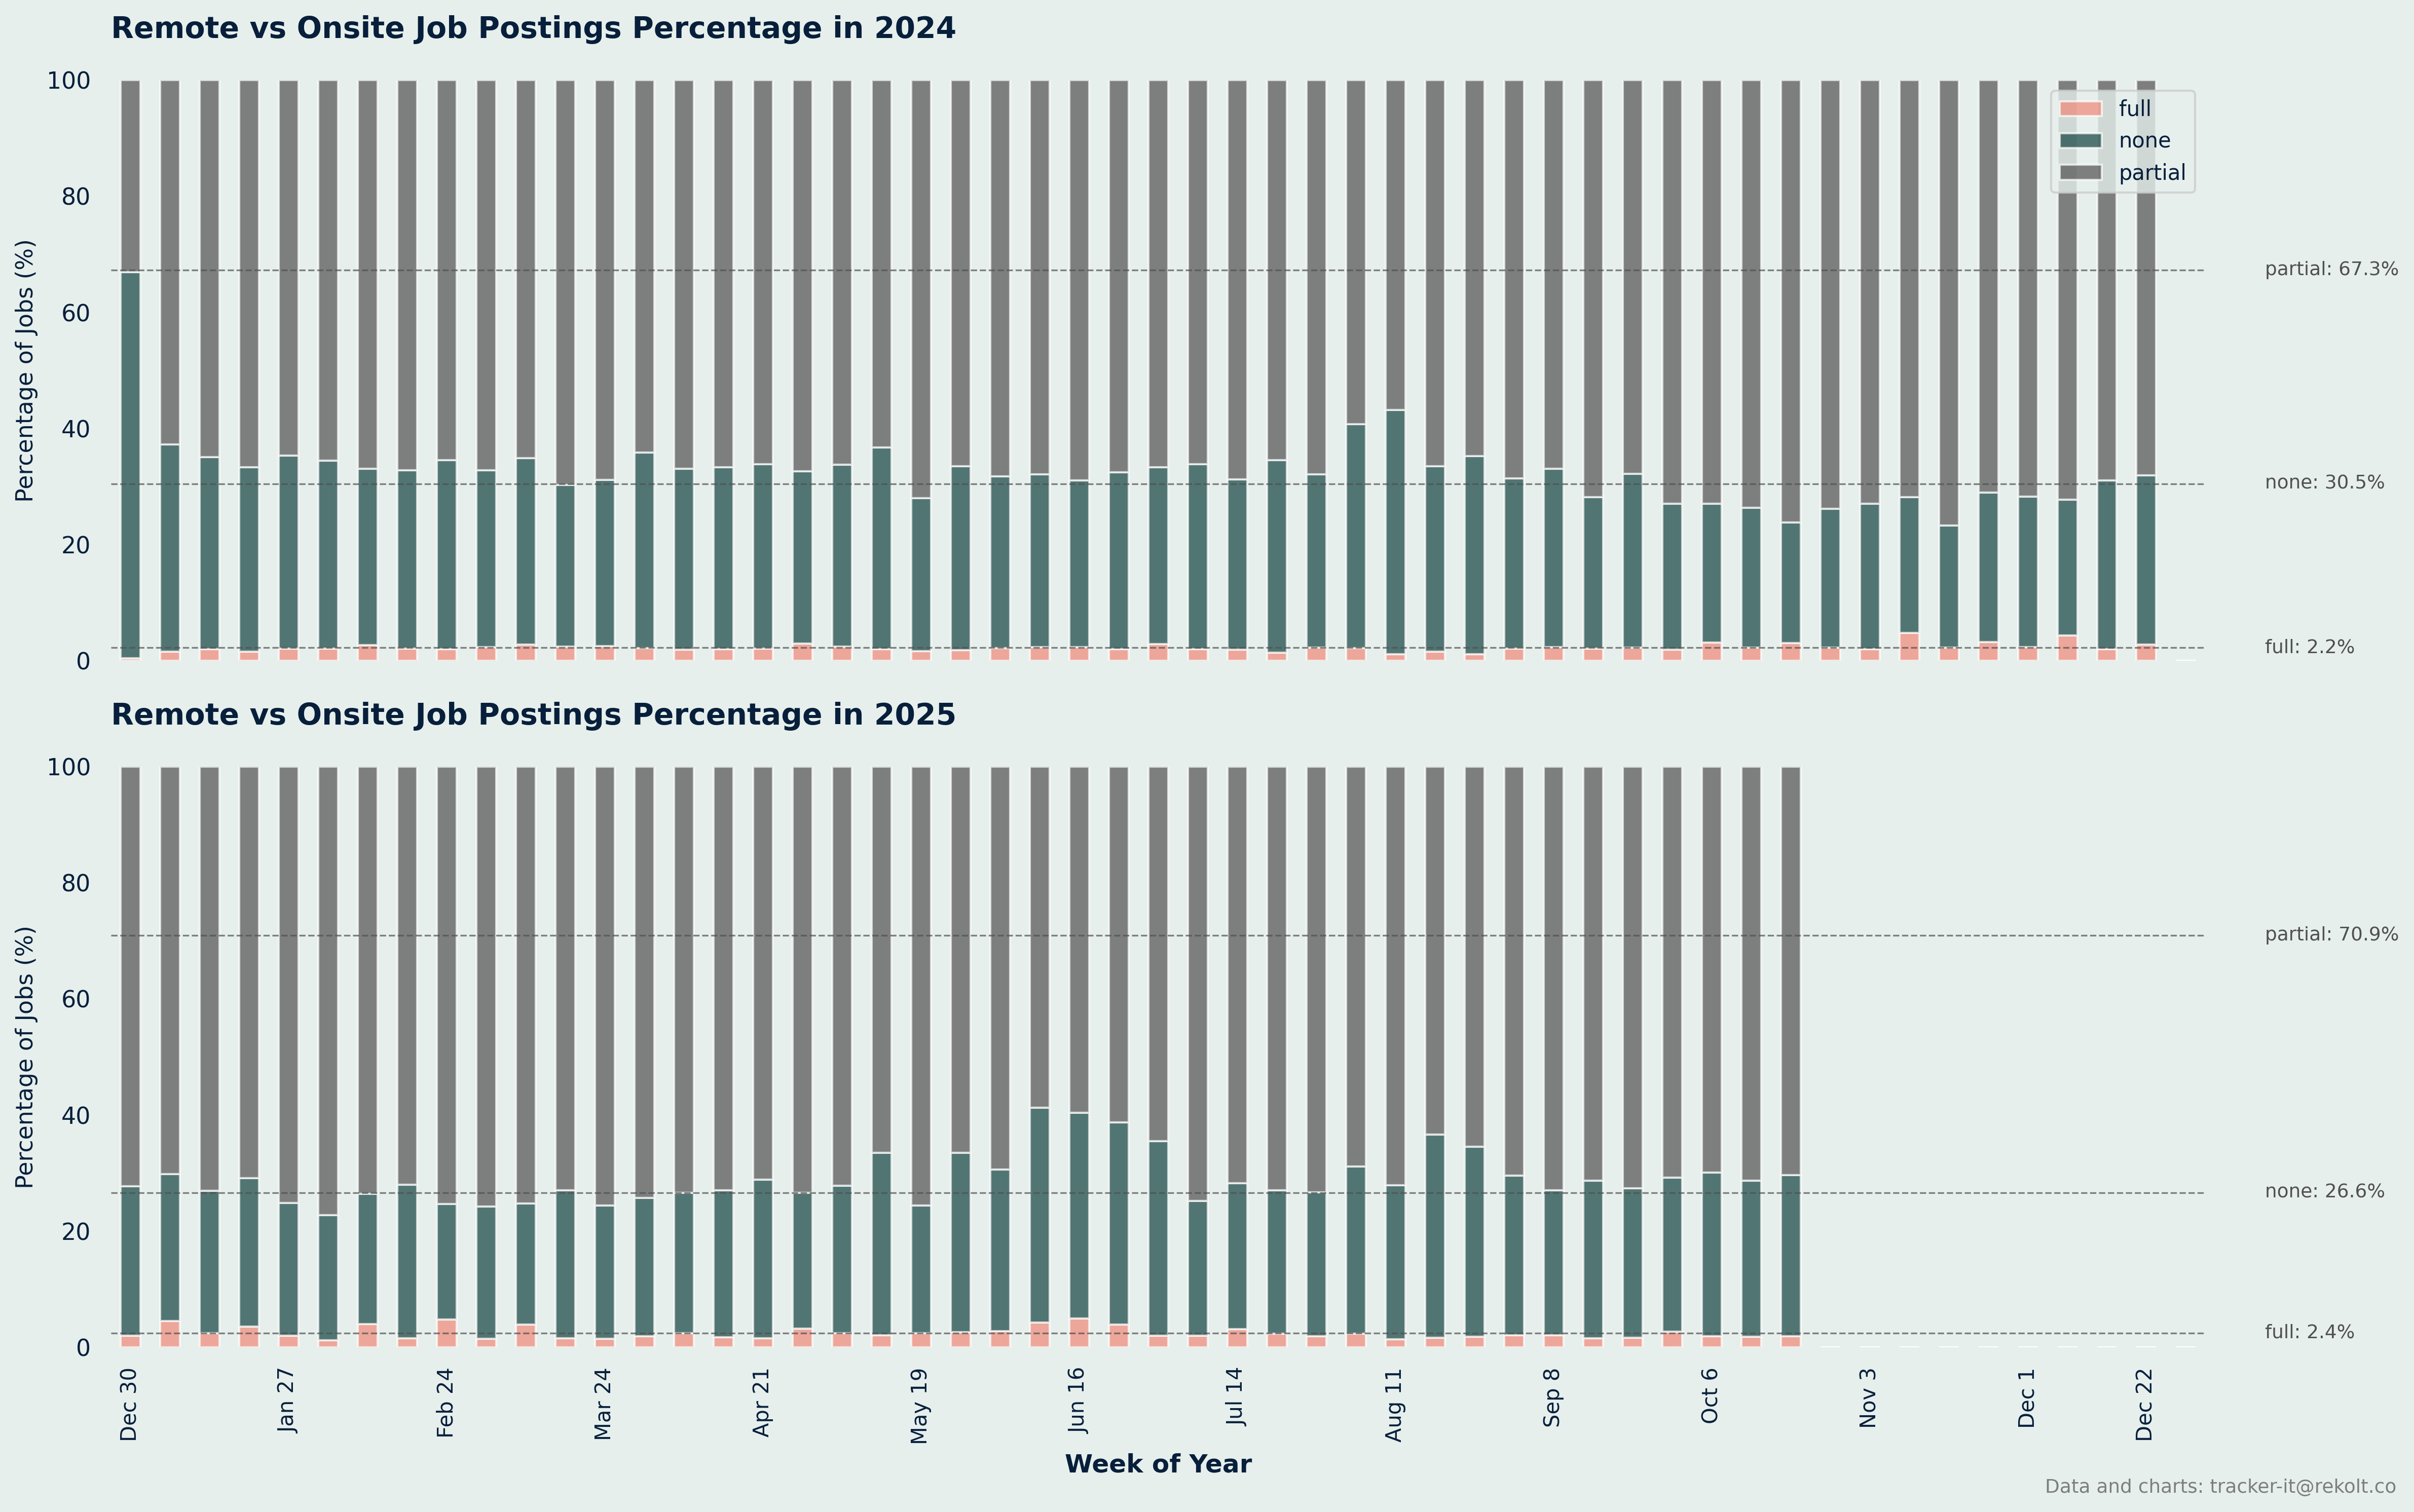
Remote Vs Onsite Percentage Summary
📊 Remote vs Onsite Job Postings Percentage Summary:
2024: 5200 total jobs
	 Remote: 116 per week
		 percentage: 2.2%
	 Partial: 3500 per week
		 percentage: 67.3%
2025: 4300 total jobs
	 Remote: 104 per week
		 percentage: 2.4%
	 Partial: 3051 per week
		 percentage: 70.9%
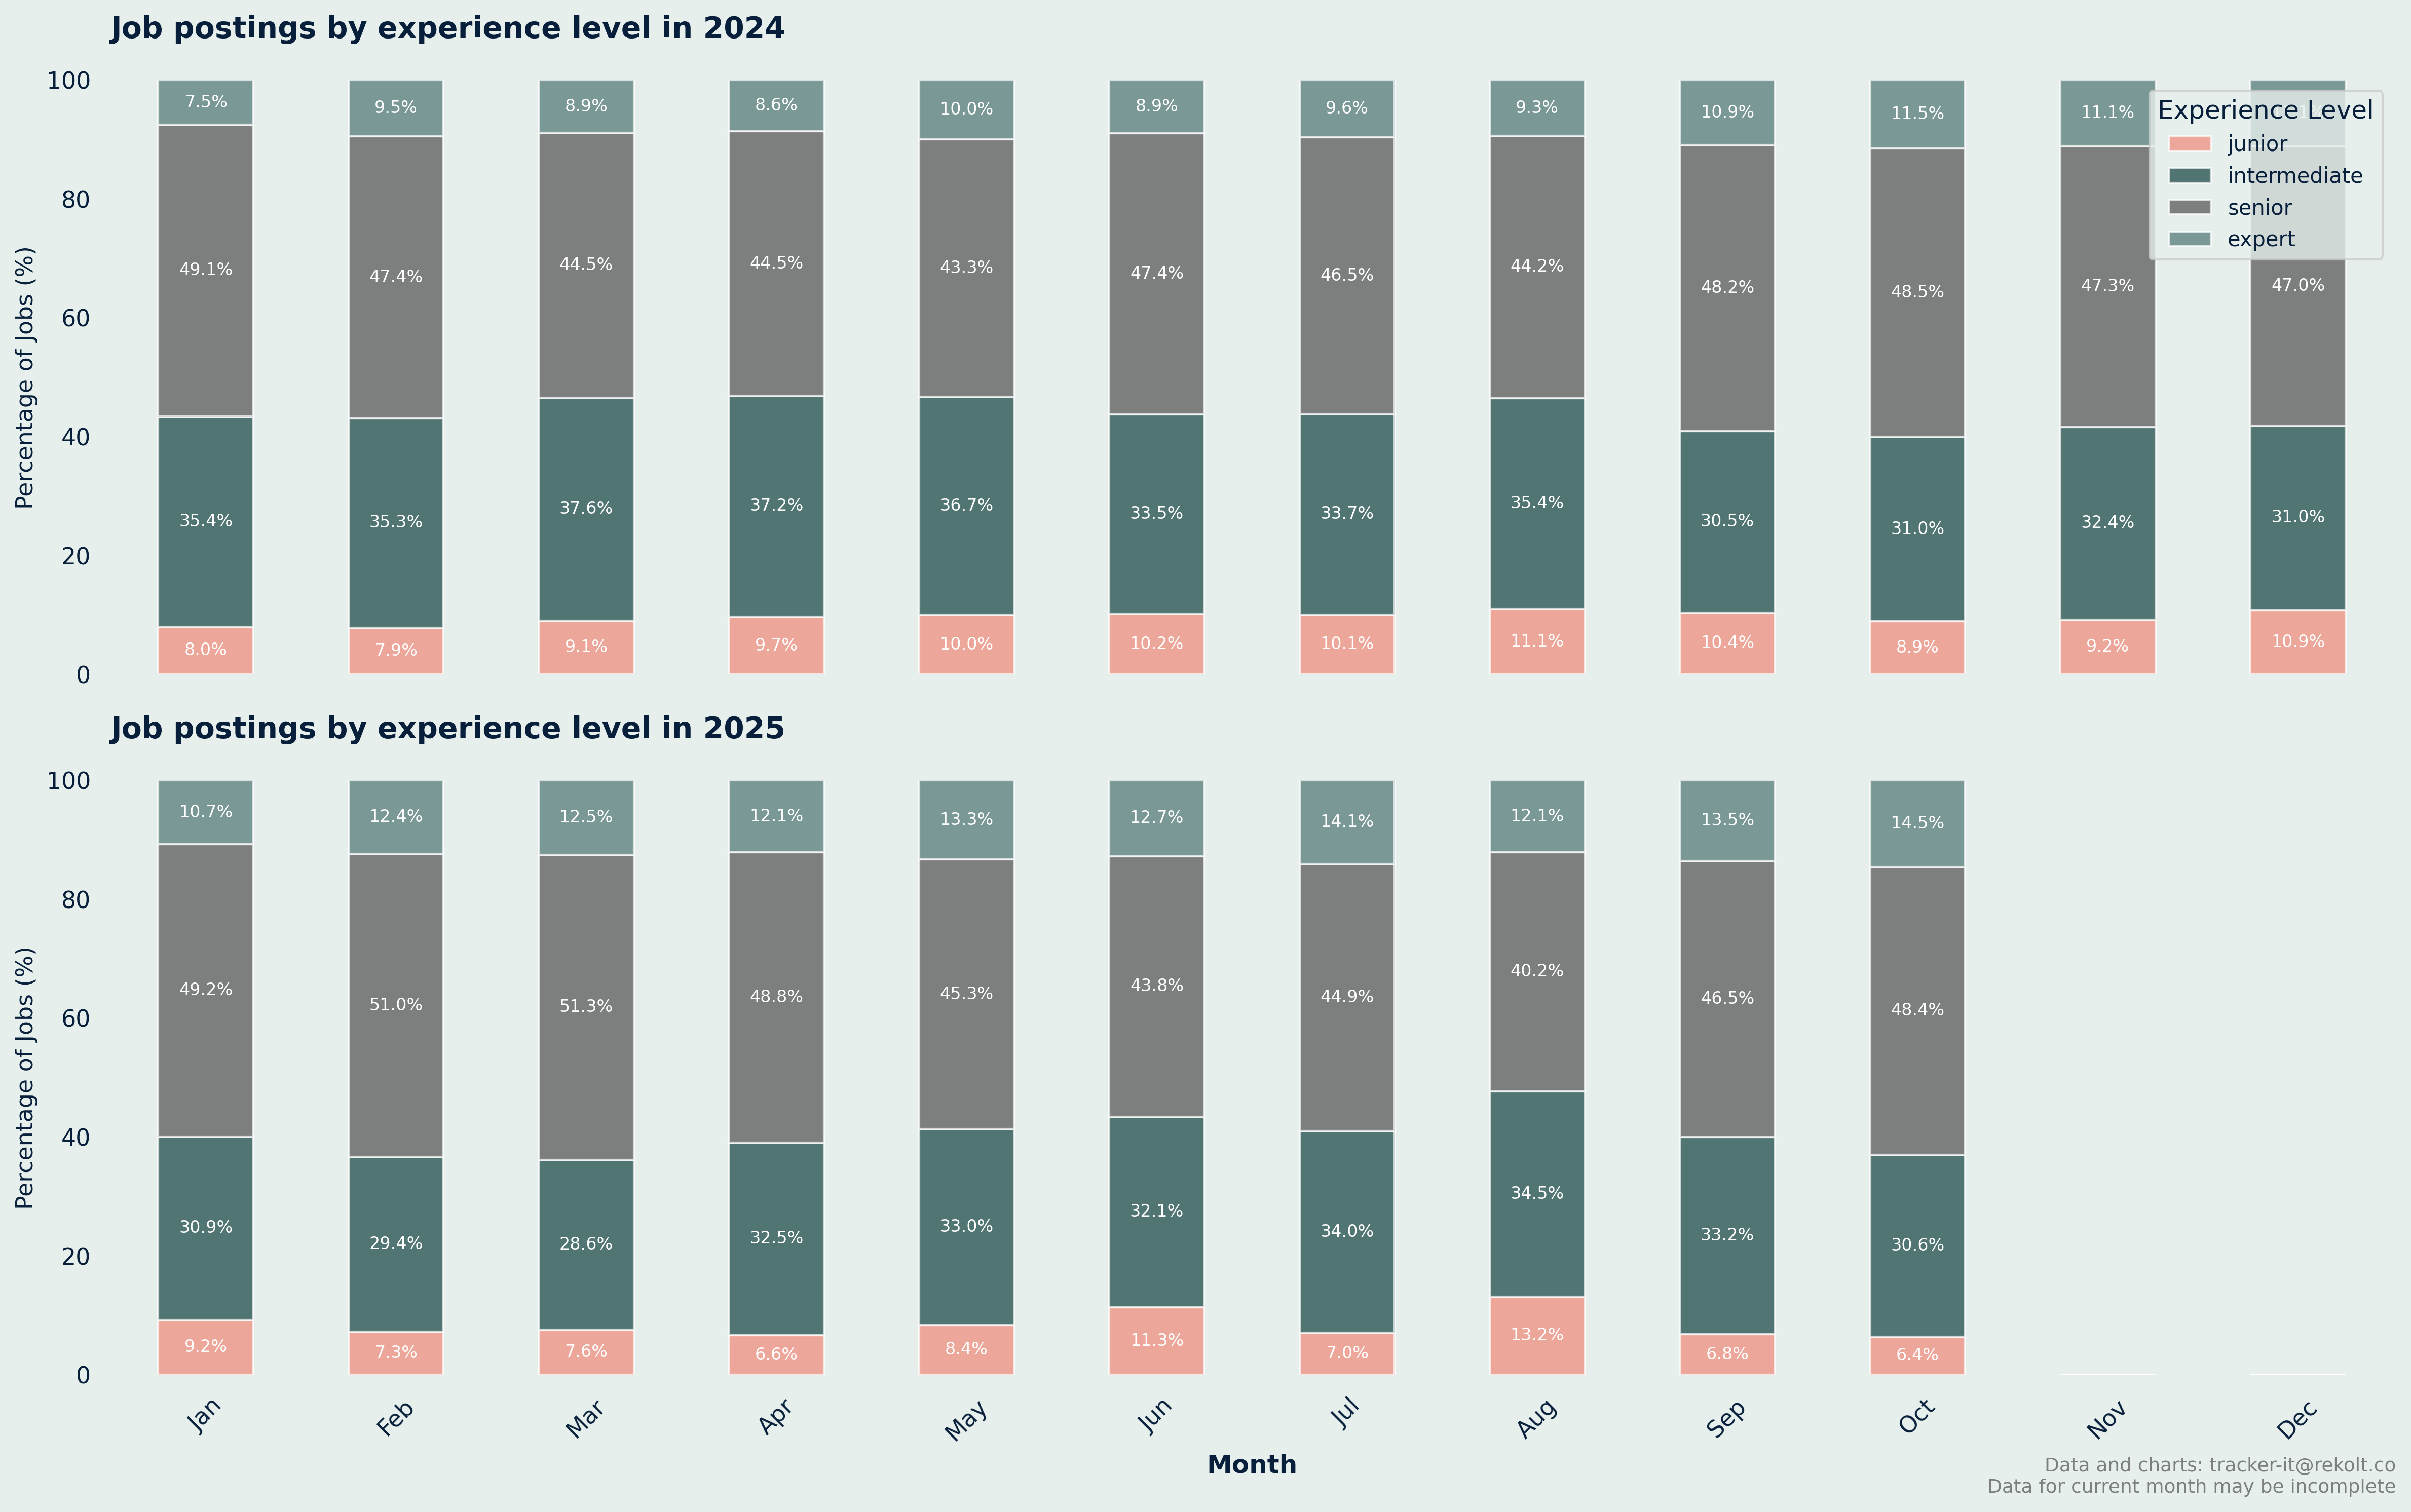
Experience Level Summary
 Monthly Job Postings by Experience Level Summary:
2024:
	 Junior: 17268 jobs
		 percentage: 8.9%
	 Intermediate: 64833 jobs
		 percentage: 33.4%
	 Senior: 91647 jobs
		 percentage: 47.2%
	 Expert: 20476 jobs
		 percentage: 10.5%
2025:
	 Junior: 17268 jobs
		 percentage: 8.9%
	 Intermediate: 64833 jobs
		 percentage: 33.4%
	 Senior: 91647 jobs
		 percentage: 47.2%
	 Expert: 20476 jobs
		 percentage: 10.5%
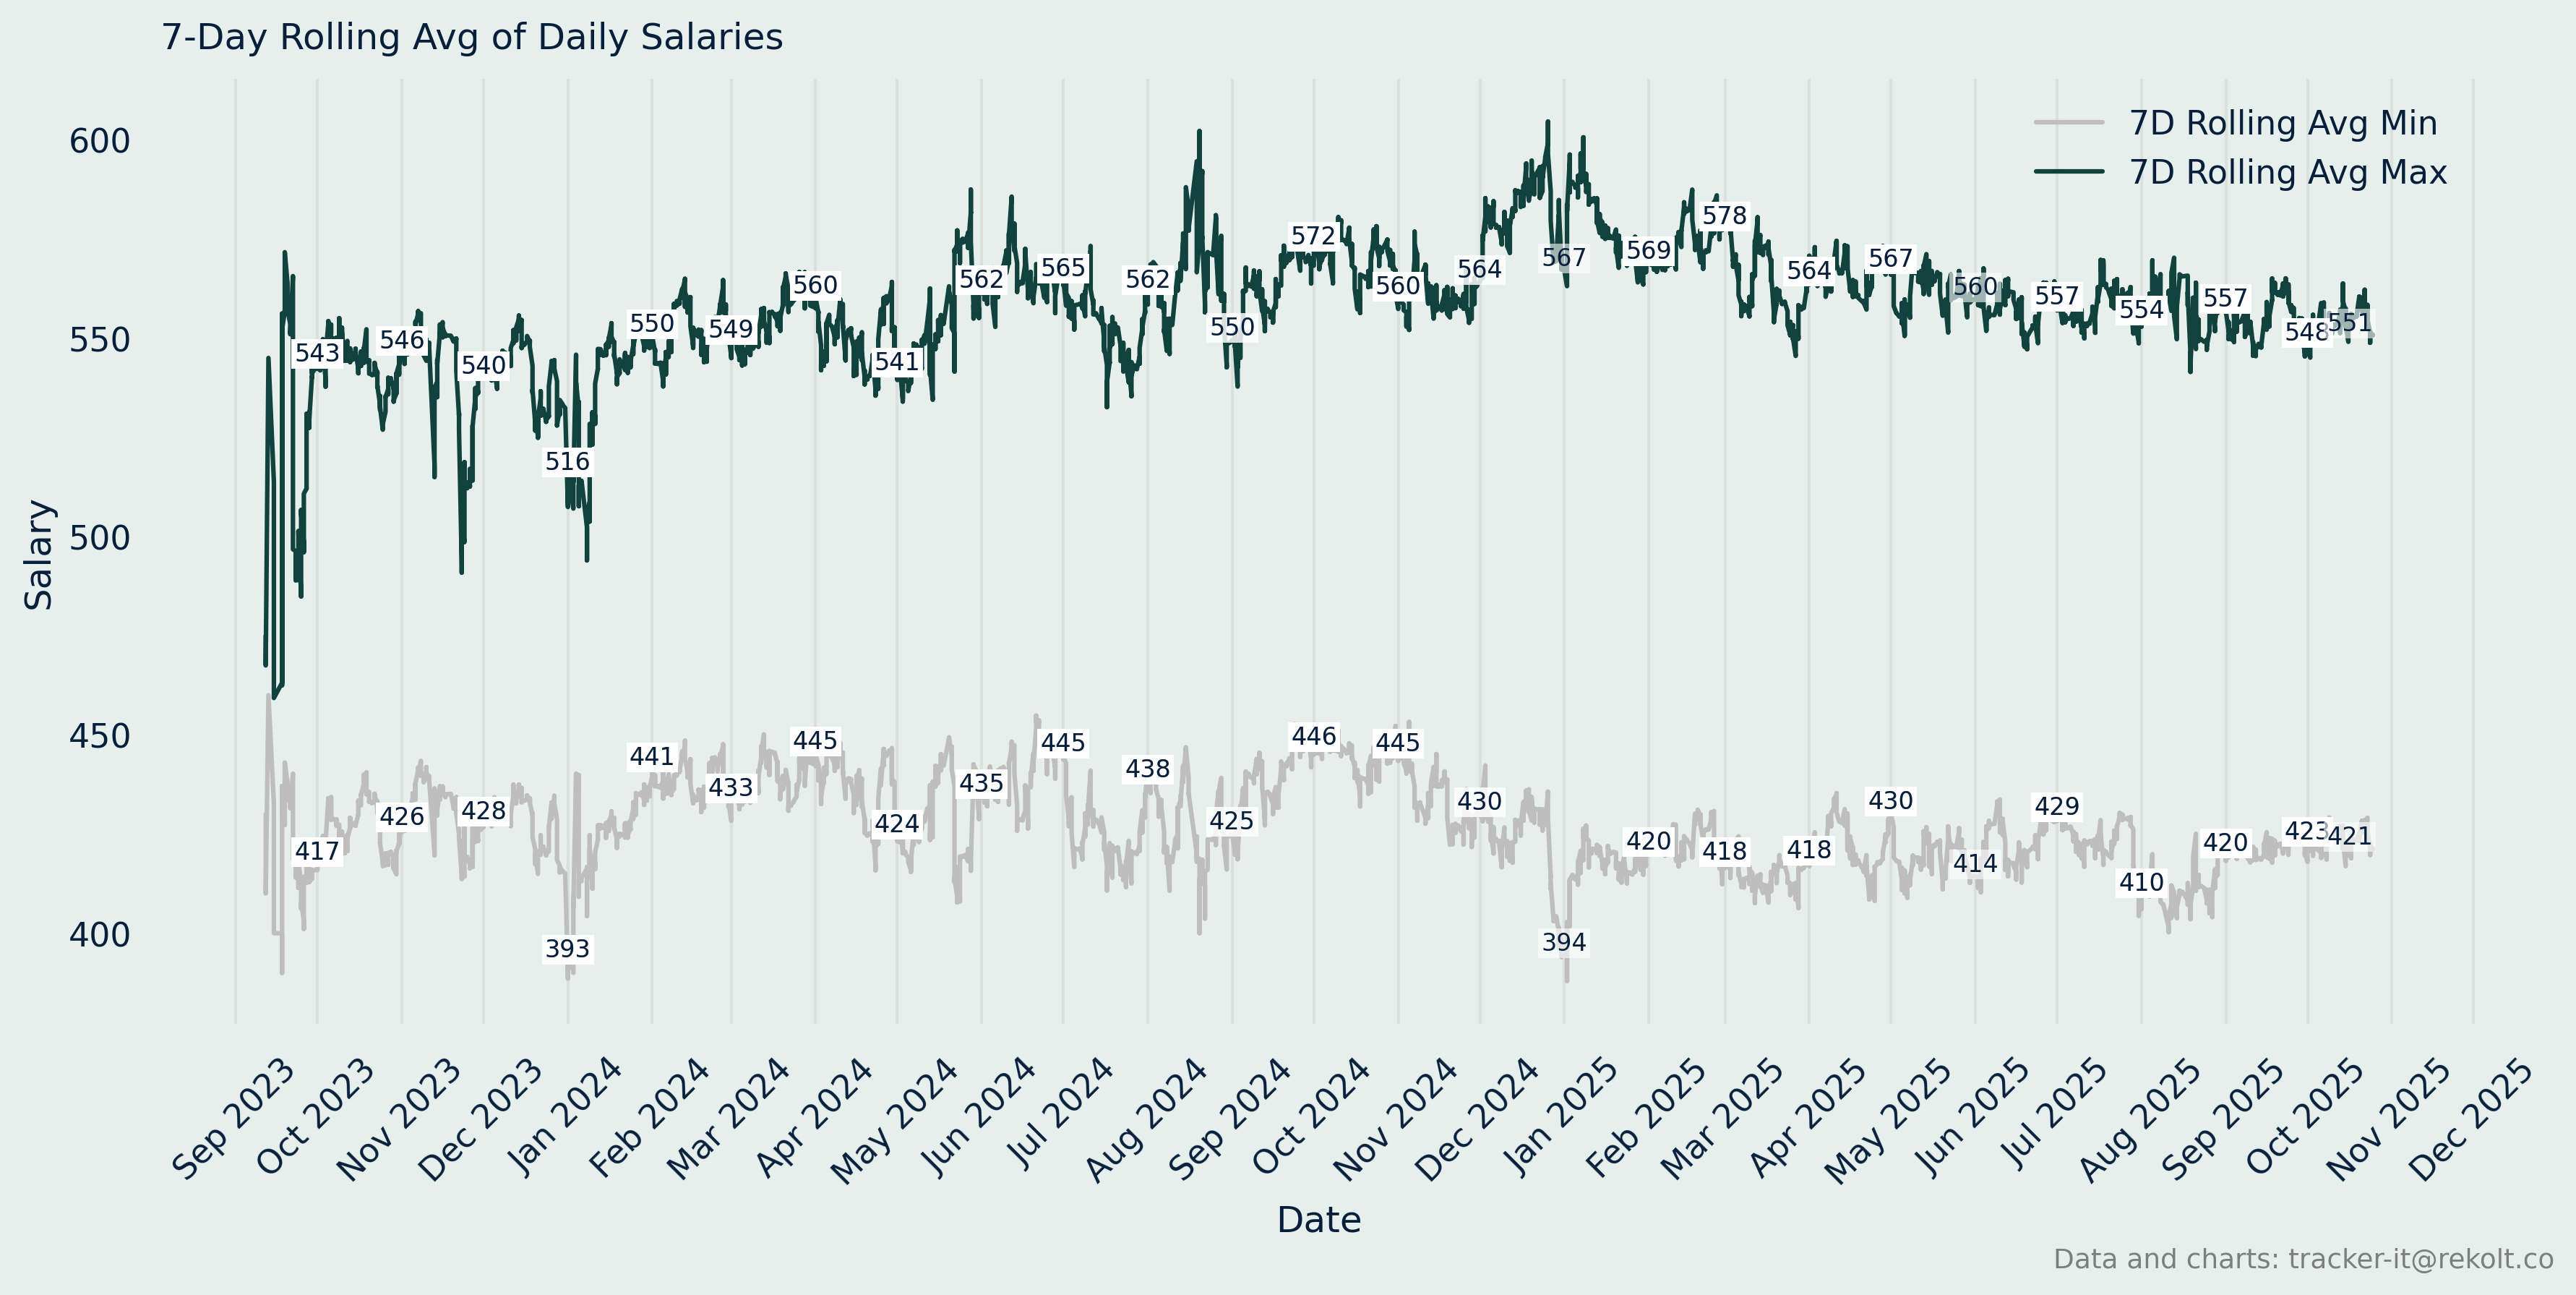
Annual Salary Summary
 Annual Salary Summary:
2023:
	 Average min salary: 428
	 Average max salary: 543

2024:
	 Average min salary: 434
	 Average max salary: 560

2025:
	 Average min salary: 420
	 Average max salary: 562