Tracker
Demand Tracker of IT projects for freelancers, France
Last update: 2023-07-23
Get weekly updates by joining the telegram channel
Am I the only freelancer suffering from a decreasing demand?
Are you no longer receiving propositions as frequently as before? Is the client’s sole focus securing the lowest rate possible? Are projects now shorter in duration? And what about remote job offers? Have they decreased even more compared to pre-pandemic times?
Can we blame intermediaries for this situation? Is the market overcrowded with individuals leaving their jobs and taking advantage of “chômage”?
The goal of this page is to provide you with an overview of the demand for IT freelancers in France. It may not fully reflect the market, as it is based on the information we could gather from various sources. Now, let’s examine the extent of the damage, who is affected, and what the current demand looks like.
Perimeter
Date: From May 2023
Projects: 12 518 job offers for freelancers in IT / Tech / Data
The wilderness
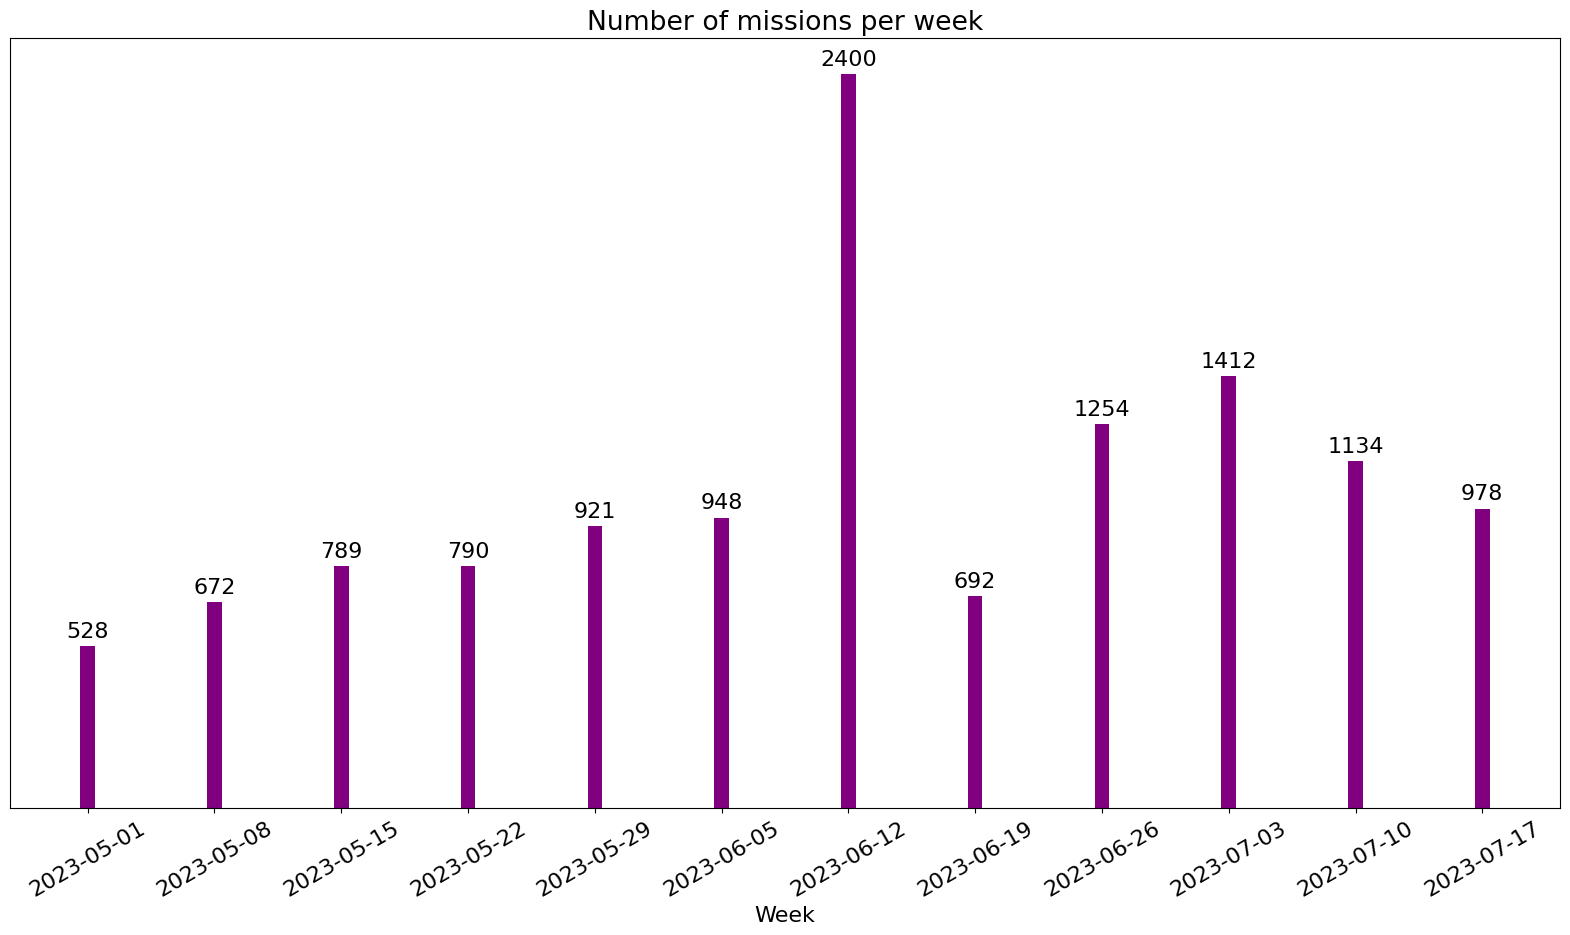
Summer is definitely here, less projects published, last interviews before the holidays. If you do not have a project for September, time to pick up your phone and call your network.

And the rates?
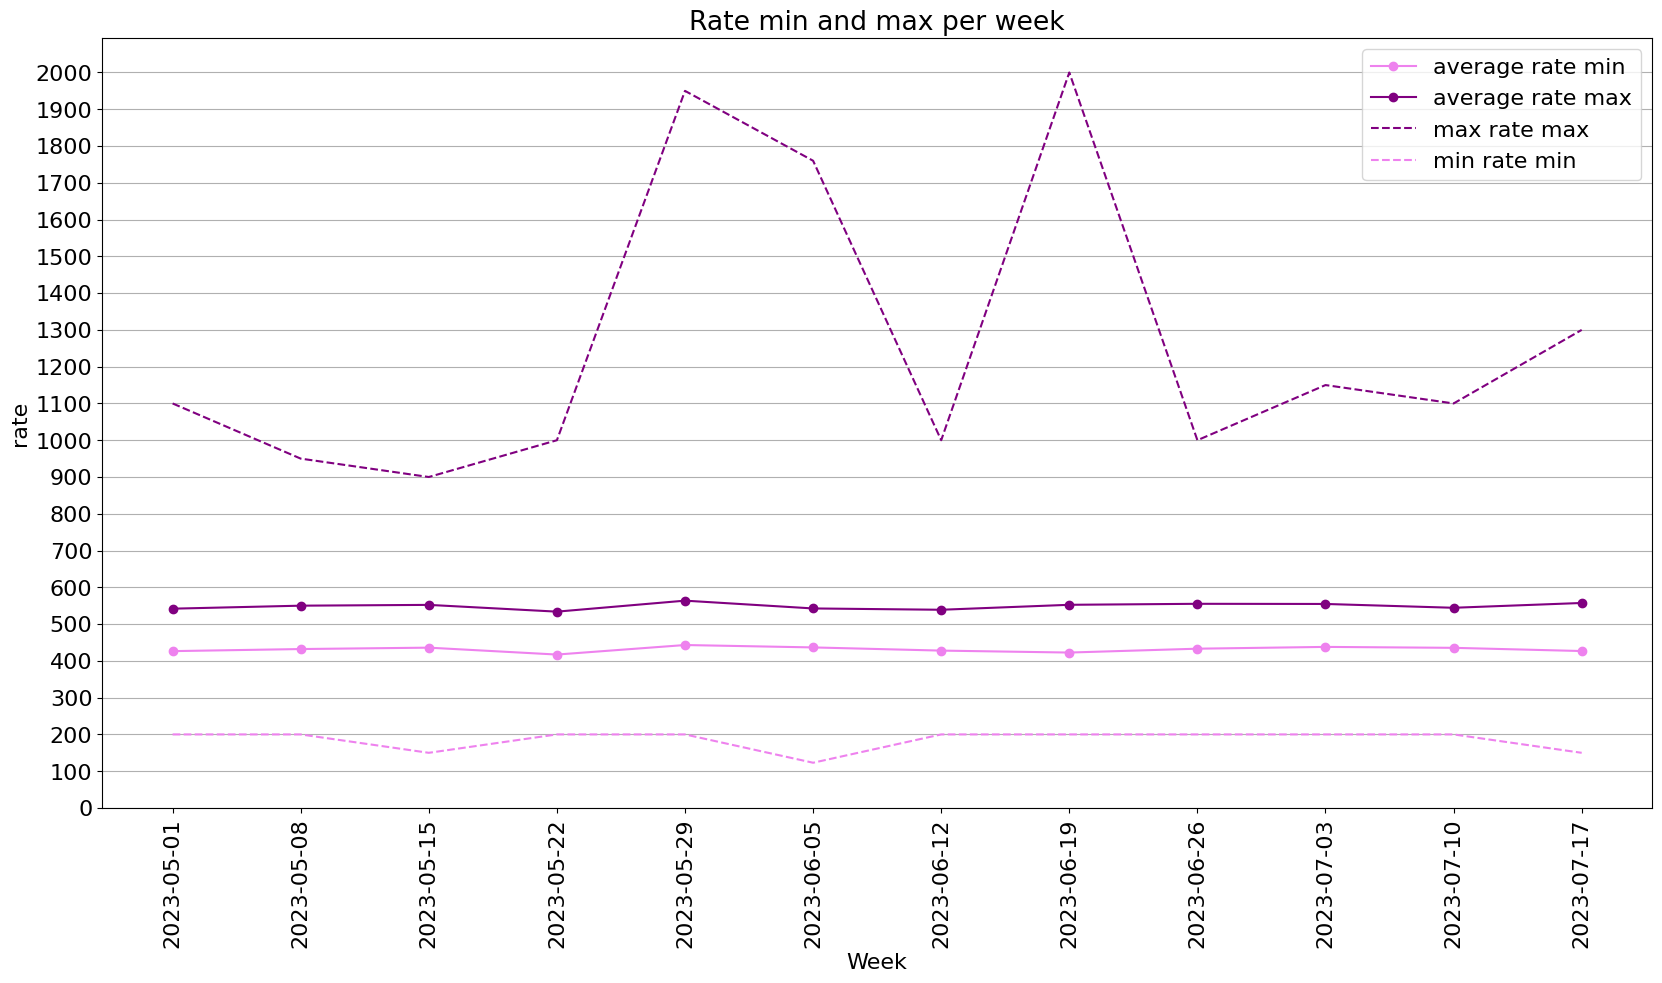
Since we don’t have data before May 2023 and usually rates’ evolutions can be observed on the yearly level, we can’t conclude that much on the rates. But we actualized the chart with the latest data. And last week, there’s this - cute - flexions : max rate is increasing, min rate is decreasing. *We are working on finding more historical data”

Who do they want?
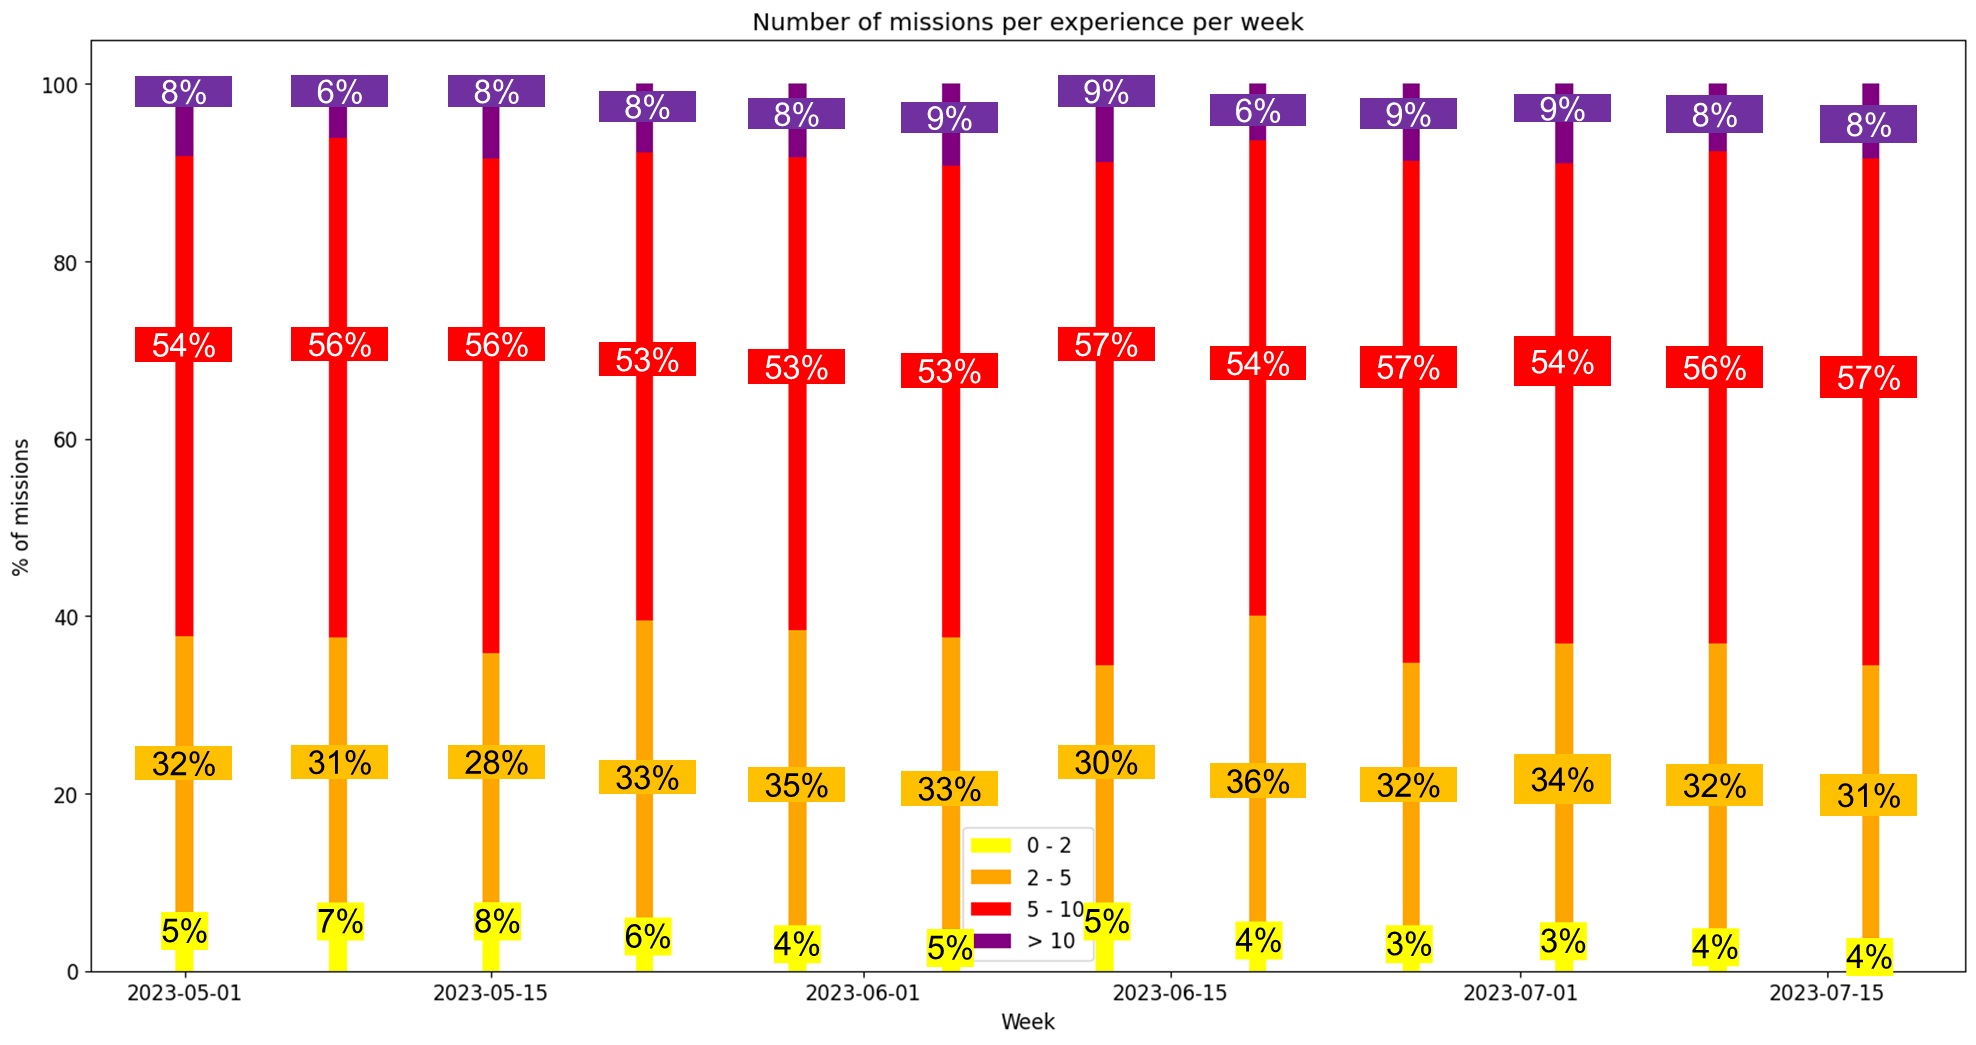
The demand does not seem to have high fluctuations when it comes to the experience wanted for the projects. Same proportions, with the demand clearly in the advantage of the 5-10 years experience.

Where do they want them?
Freelancing is still very centralized around Paris and its region,- 58% of the projects of last week were located in Paris and Île-de-France. Overall, the share of projects in Paris and its region has been increasing during the last weeks.
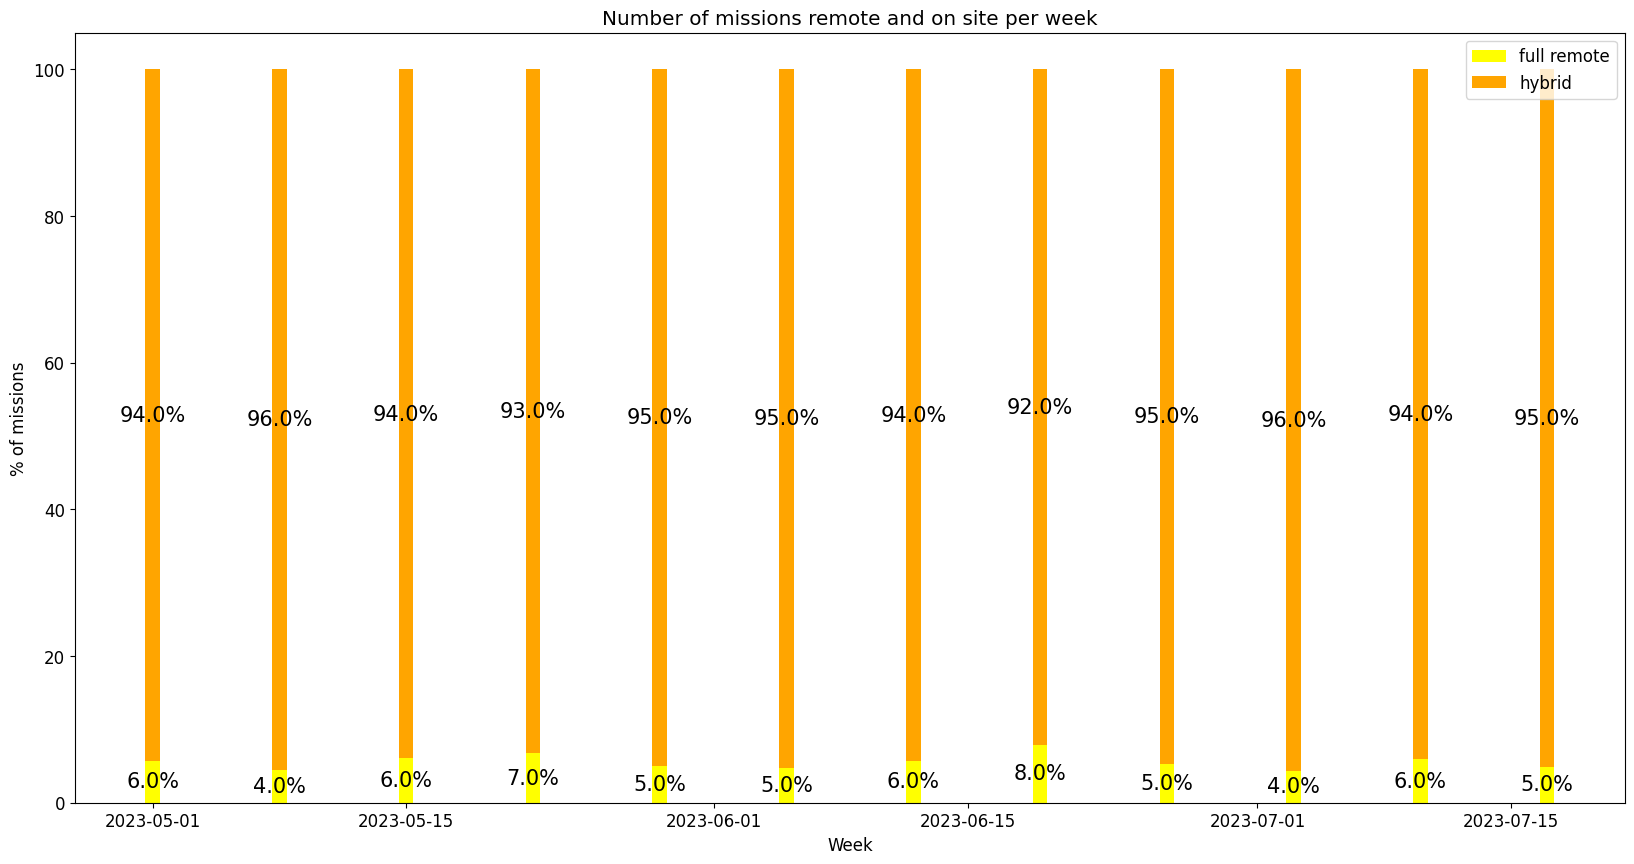
In average, only 5% of the projects can be done full remote. Time to consider a pied-à-terre in Paris?

Backlog of analysis
That’s all for today :) Next steps:
- Update the data every week
- Do some NLP on the job descriptions and titles to identify the most popular technologies and positions and their evolution (I know this one has been in the to do for long now)
- Maybe add other geographies PS: there are some exclusive analysis posted on the telegram channel
If you have any comments or ideas, send me an e-mail